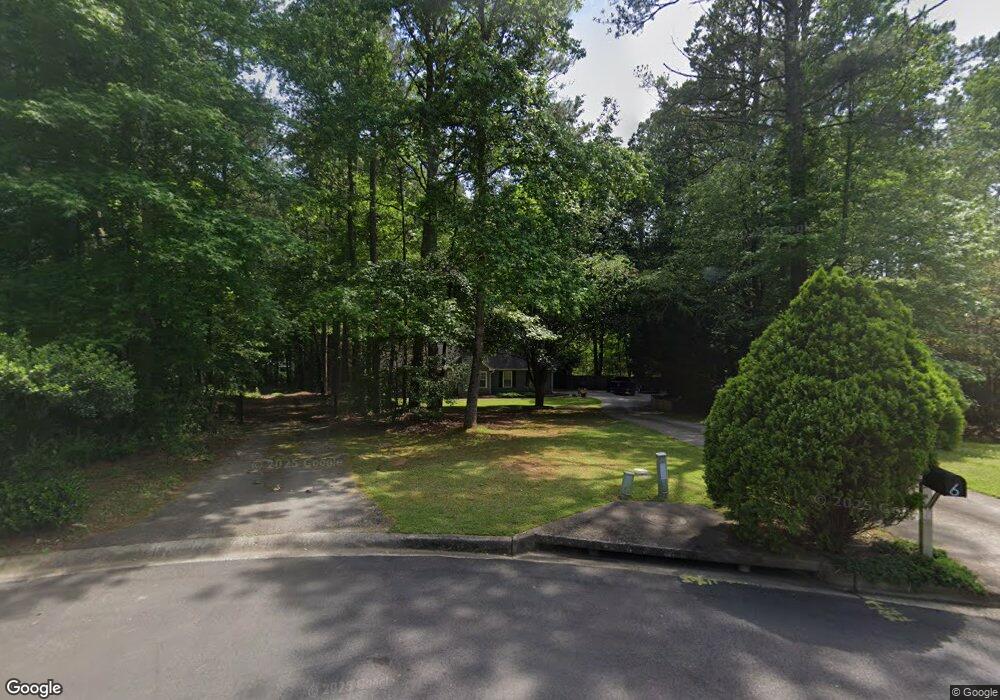
6 Marsha Way Sharpsburg, GA 30277
Estimated Value: $253,461 - $322,000
3
Beds
2
Baths
1,188
Sq Ft
$247/Sq Ft
Est. Value
About This Home
This home is located at 6 Marsha Way, Sharpsburg, GA 30277 and is currently estimated at $293,615, approximately $247 per square foot. 6 Marsha Way is a home located in Coweta County with nearby schools including Poplar Road Elementary School, East Coweta Middle School, and East Coweta High School.
Ownership History
Date
Name
Owned For
Owner Type
Purchase Details
Closed on
Dec 14, 2002
Sold by
Bourque Robert F
Bought by
Bourque Robert F
Current Estimated Value
Home Financials for this Owner
Home Financials are based on the most recent Mortgage that was taken out on this home.
Original Mortgage
$108,500
Outstanding Balance
$45,111
Interest Rate
5.92%
Mortgage Type
New Conventional
Estimated Equity
$248,504
Purchase Details
Closed on
Feb 17, 1995
Sold by
Lindsey Homes
Bought by
Bourque Robert
Home Financials for this Owner
Home Financials are based on the most recent Mortgage that was taken out on this home.
Original Mortgage
$78,170
Interest Rate
9.21%
Mortgage Type
FHA
Purchase Details
Closed on
Jan 5, 1995
Bought by
David Lindsey Homes
Home Financials for this Owner
Home Financials are based on the most recent Mortgage that was taken out on this home.
Original Mortgage
$78,170
Interest Rate
9.21%
Mortgage Type
FHA
Purchase Details
Closed on
May 27, 1993
Bought by
Reese Builders & Dev
Create a Home Valuation Report for This Property
The Home Valuation Report is an in-depth analysis detailing your home's value as well as a comparison with similar homes in the area
Home Values in the Area
Average Home Value in this Area
Purchase History
| Date | Buyer | Sale Price | Title Company |
|---|---|---|---|
| Bourque Robert F | -- | -- | |
| Bourque Robert | $79,700 | -- | |
| David Lindsey Homes | $88,500 | -- | |
| Reese Builders & Dev | $480,100 | -- |
Source: Public Records
Mortgage History
| Date | Status | Borrower | Loan Amount |
|---|---|---|---|
| Open | Bourque Robert F | $108,500 | |
| Closed | Bourque Robert F | $108,500 | |
| Previous Owner | Bourque Robert | $78,170 |
Source: Public Records
Tax History Compared to Growth
Tax History
| Year | Tax Paid | Tax Assessment Tax Assessment Total Assessment is a certain percentage of the fair market value that is determined by local assessors to be the total taxable value of land and additions on the property. | Land | Improvement |
|---|---|---|---|---|
| 2025 | $2,127 | $91,167 | $26,000 | $65,167 |
| 2024 | $2,029 | $85,212 | $26,000 | $59,212 |
| 2023 | $2,029 | $89,186 | $24,000 | $65,186 |
| 2022 | $1,797 | $71,654 | $20,000 | $51,654 |
| 2021 | $1,574 | $58,646 | $16,000 | $42,646 |
| 2020 | $1,600 | $58,646 | $16,000 | $42,646 |
| 2019 | $1,588 | $53,222 | $10,000 | $43,222 |
| 2018 | $1,597 | $53,222 | $10,000 | $43,222 |
| 2017 | $1,443 | $48,434 | $10,000 | $38,434 |
| 2016 | $1,437 | $48,434 | $10,000 | $38,434 |
| 2015 | $1,265 | $43,646 | $10,000 | $33,646 |
| 2014 | $1,114 | $38,858 | $10,000 | $28,858 |
Source: Public Records
Map
Nearby Homes
- 138 Main St
- 140 Halo Trace
- 1 Mcintosh Trail
- 0 Bob Smith Rd Unit 10562838
- 196 Bob Smith Rd
- 250 Bob Smith Rd
- 180 Saint James Place
- 296 Mcintosh Trail
- 28 Fawn Ct
- 25 Chemin Place
- 25 Lentry Dr
- 0 Highway 154 Unit 10470800
- 46 Lullwater Ct
- 8 Chiefs Trail
- 565 Timberbrook Dr
- 483 Mcintosh Trail
- Briarwood Plan at Twelve Parks 55+
- Sullivan Plan at Twelve Parks 55+
- 4 Unicoi Trail
- 12 Unicoi Trail
- 8 Marsha Way Unit /A-10
- 8 Marsha Way
- 7 Marsha Way
- 33 Angel Trace
- 13 Angel Trace
- 68 Norman Way
- 5 Marsha Way
- 82 Norman Way
- 15 Marsha Way
- 18 Marsha Way
- 60 Norman Way
- 47 Angel Trace
- 54 Norman Way
- 34 Angel Trace
- 19 Marsha Way
- 46 Marsha Way Unit A-12
- 46 Marsha Way
- 26 Angel Trace
- 52 Angel Trace
- 14 Angel Trace