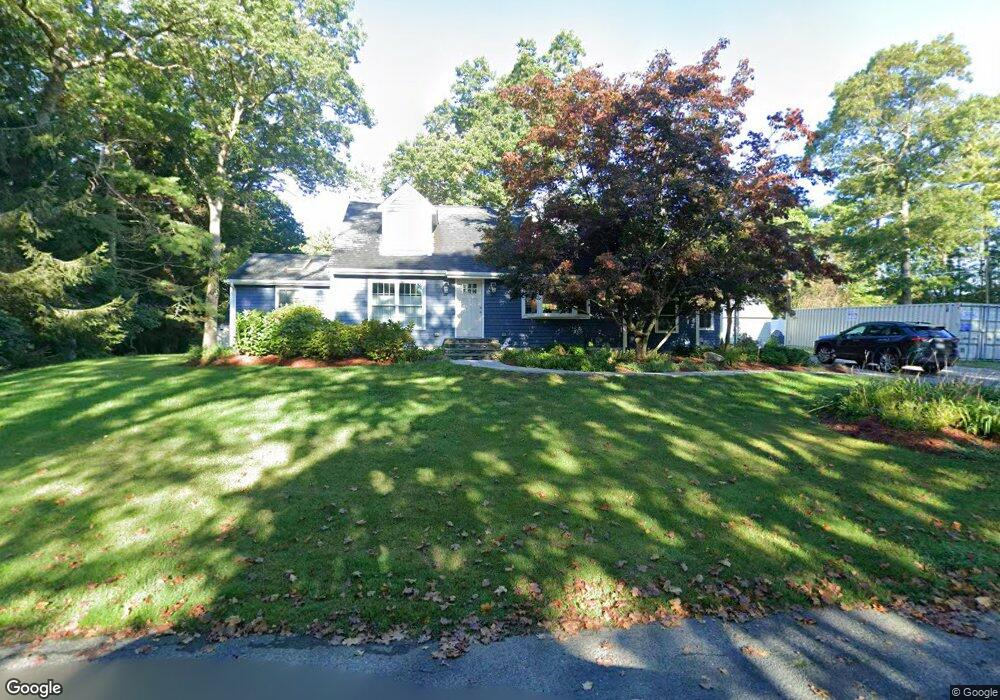
6 Marshall Way Rehoboth, MA 02769
Estimated Value: $313,000 - $728,000
4
Beds
2
Baths
1,950
Sq Ft
$284/Sq Ft
Est. Value
About This Home
This home is located at 6 Marshall Way, Rehoboth, MA 02769 and is currently estimated at $554,322, approximately $284 per square foot. 6 Marshall Way is a home located in Bristol County with nearby schools including Dighton-Rehoboth Regional High School and Cedar Brook School.
Ownership History
Date
Name
Owned For
Owner Type
Purchase Details
Closed on
Apr 25, 2008
Sold by
Guarino John R and Guarino Karen J
Bought by
Tinkham Brent
Current Estimated Value
Home Financials for this Owner
Home Financials are based on the most recent Mortgage that was taken out on this home.
Original Mortgage
$310,133
Interest Rate
6.22%
Mortgage Type
Purchase Money Mortgage
Purchase Details
Closed on
Jan 13, 1999
Sold by
Nuss Diane E and Nuss Stephen
Bought by
Bradbury Paul W and Bradbury Dorothy L
Home Financials for this Owner
Home Financials are based on the most recent Mortgage that was taken out on this home.
Original Mortgage
$168,600
Interest Rate
6.7%
Mortgage Type
Purchase Money Mortgage
Create a Home Valuation Report for This Property
The Home Valuation Report is an in-depth analysis detailing your home's value as well as a comparison with similar homes in the area
Home Values in the Area
Average Home Value in this Area
Purchase History
| Date | Buyer | Sale Price | Title Company |
|---|---|---|---|
| Tinkham Brent | $315,000 | -- | |
| Bradbury Paul W | $170,000 | -- |
Source: Public Records
Mortgage History
| Date | Status | Borrower | Loan Amount |
|---|---|---|---|
| Open | Bradbury Paul W | $312,721 | |
| Closed | Tinkham Brent | $310,133 | |
| Previous Owner | Bradbury Paul W | $168,600 | |
| Previous Owner | Bradbury Paul W | $95,000 |
Source: Public Records
Tax History Compared to Growth
Tax History
| Year | Tax Paid | Tax Assessment Tax Assessment Total Assessment is a certain percentage of the fair market value that is determined by local assessors to be the total taxable value of land and additions on the property. | Land | Improvement |
|---|---|---|---|---|
| 2025 | $51 | $457,100 | $152,000 | $305,100 |
| 2024 | $5,110 | $449,800 | $182,400 | $267,400 |
| 2023 | $4,807 | $415,100 | $178,800 | $236,300 |
| 2022 | $4,400 | $347,300 | $163,900 | $183,400 |
| 2021 | $0 | $333,300 | $149,100 | $184,200 |
| 2020 | $4,418 | $336,700 | $156,200 | $180,500 |
| 2018 | $4,800 | $304,400 | $148,700 | $155,700 |
| 2017 | $3,521 | $280,300 | $148,700 | $131,600 |
| 2016 | $3,344 | $275,200 | $155,500 | $119,700 |
| 2015 | $3,537 | $287,300 | $148,100 | $139,200 |
| 2014 | $3,364 | $270,400 | $141,000 | $129,400 |
Source: Public Records
Map
Nearby Homes
- 67 Wheeler St
- 23 Colonial Way
- 37 Colonial Way
- 111 Summer St
- 20 School St
- 0 Winter St
- 9 Hidden Hills Dr
- 6 Running Stream Rd
- 15 Hickory Ridge Rd
- 25 Lincoln St
- 16 Salisbury St
- 198 Brook St
- 31 Woodland Way
- 8 Linden Ln
- 8 Linden Ln
- 824 Taunton Ave
- 248 County
- 63 Moulton St
- 205 Providence St Bldr Lot 3
- 203 Providence St Bldr Lot 5