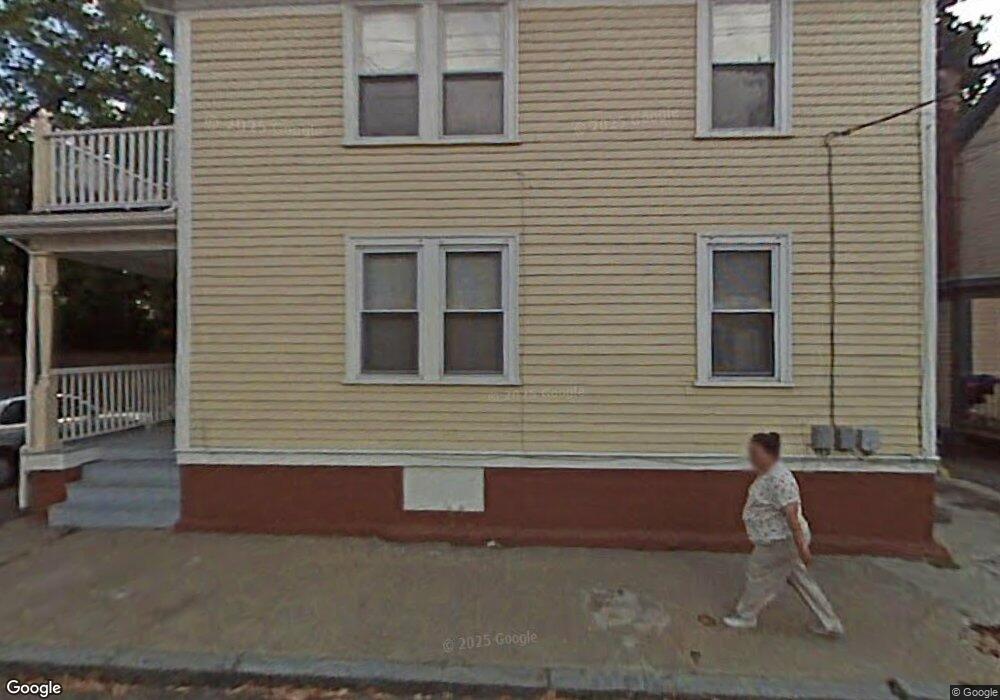
6 Marvin St Providence, RI 02909
West End NeighborhoodEstimated Value: $356,766 - $510,000
6
Beds
2
Baths
2,080
Sq Ft
$220/Sq Ft
Est. Value
About This Home
This home is located at 6 Marvin St, Providence, RI 02909 and is currently estimated at $456,692, approximately $219 per square foot. 6 Marvin St is a home located in Providence County with nearby schools including Paul Cuffee Middle School and Holy Ghost School.
Ownership History
Date
Name
Owned For
Owner Type
Purchase Details
Closed on
May 29, 2008
Sold by
Aurora Loan Services L
Bought by
Ruh James
Current Estimated Value
Home Financials for this Owner
Home Financials are based on the most recent Mortgage that was taken out on this home.
Original Mortgage
$158,746
Outstanding Balance
$100,691
Interest Rate
5.91%
Mortgage Type
Purchase Money Mortgage
Estimated Equity
$356,001
Purchase Details
Closed on
Oct 27, 1995
Sold by
Fahey Gerard P and Weiser Herbert
Bought by
Nunez Maria M
Home Financials for this Owner
Home Financials are based on the most recent Mortgage that was taken out on this home.
Original Mortgage
$37,219
Interest Rate
7.6%
Mortgage Type
Purchase Money Mortgage
Create a Home Valuation Report for This Property
The Home Valuation Report is an in-depth analysis detailing your home's value as well as a comparison with similar homes in the area
Home Values in the Area
Average Home Value in this Area
Purchase History
| Date | Buyer | Sale Price | Title Company |
|---|---|---|---|
| Ruh James | $160,000 | -- | |
| Aurora Loan Services L | $236,000 | -- | |
| Nunez Maria M | $37,000 | -- |
Source: Public Records
Mortgage History
| Date | Status | Borrower | Loan Amount |
|---|---|---|---|
| Open | Nunez Maria M | $158,746 | |
| Previous Owner | Nunez Maria M | $37,219 |
Source: Public Records
Tax History
| Year | Tax Paid | Tax Assessment Tax Assessment Total Assessment is a certain percentage of the fair market value that is determined by local assessors to be the total taxable value of land and additions on the property. | Land | Improvement |
|---|---|---|---|---|
| 2025 | $2,817 | $373,100 | $105,600 | $267,500 |
| 2024 | $4,666 | $254,300 | $70,400 | $183,900 |
| 2023 | $4,666 | $254,300 | $70,400 | $183,900 |
| 2022 | $4,527 | $254,300 | $70,400 | $183,900 |
| 2021 | $3,124 | $127,200 | $32,800 | $94,400 |
| 2020 | $3,124 | $127,200 | $32,800 | $94,400 |
| 2019 | $3,124 | $127,200 | $32,800 | $94,400 |
| 2018 | $3,247 | $101,600 | $32,500 | $69,100 |
| 2017 | $3,247 | $101,600 | $32,500 | $69,100 |
| 2016 | $3,247 | $101,600 | $32,500 | $69,100 |
| 2015 | $2,959 | $89,400 | $32,500 | $56,900 |
| 2014 | $3,017 | $89,400 | $32,500 | $56,900 |
| 2013 | $3,017 | $89,400 | $32,500 | $56,900 |
Source: Public Records
Map
Nearby Homes
- 44 Sycamore St
- 1516 Westminster St
- 30 Rosedale St
- 70 Rosedale St Unit 1
- 59 Wendell St
- 45 Wendell St
- 102 Ellery St
- 148 Superior St
- 1447 Westminster St Unit 1C
- 10 Slocum St Unit 5
- 86 Tobey St
- 498 Broadway
- 69 Sorrento St Unit 71
- 206 Hanover St
- 283 Waldo St
- 0 Ford St
- 19 Dora St
- 103 Almy St
- 107 Ring St
- 33 Ford St
Your Personal Tour Guide
Ask me questions while you tour the home.