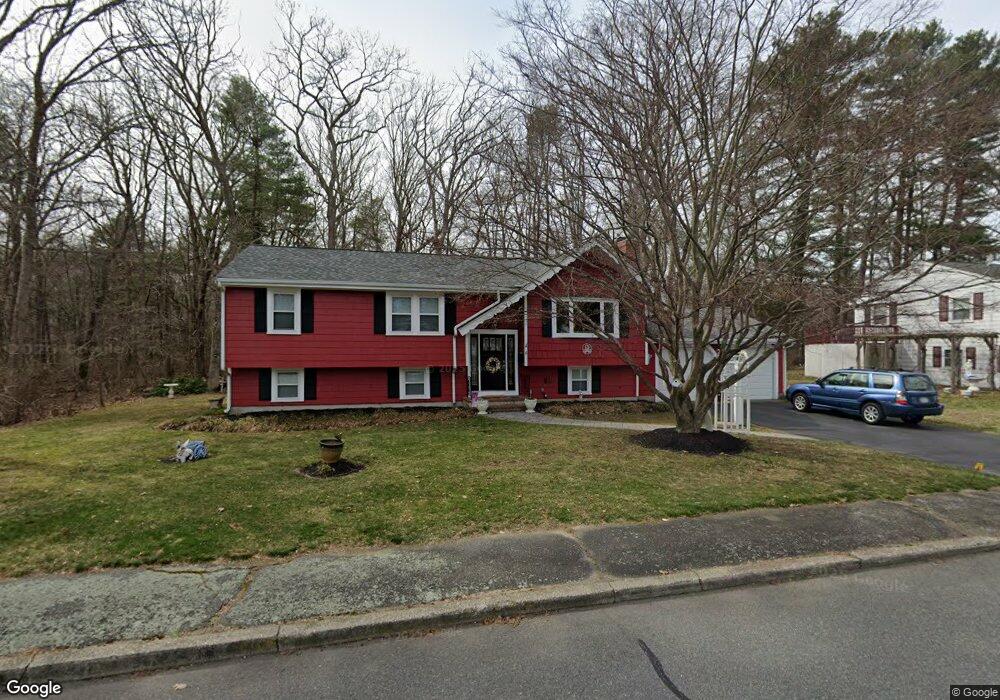
6 Mason St South Weymouth, MA 02190
South Weymouth NeighborhoodEstimated Value: $678,013 - $787,000
3
Beds
2
Baths
1,306
Sq Ft
$559/Sq Ft
Est. Value
About This Home
This home is located at 6 Mason St, South Weymouth, MA 02190 and is currently estimated at $729,503, approximately $558 per square foot. 6 Mason St is a home located in Norfolk County with nearby schools including Thomas V Nash, Abigail Adams Middle School, and Weymouth Middle School Chapman.
Ownership History
Date
Name
Owned For
Owner Type
Purchase Details
Closed on
Sep 11, 2015
Sold by
Murphy Kathleen A Est
Bought by
Anderson Ft
Current Estimated Value
Purchase Details
Closed on
Jun 5, 2006
Sold by
John D Murphy Ft
Bought by
Murphy Kathleen A
Home Financials for this Owner
Home Financials are based on the most recent Mortgage that was taken out on this home.
Original Mortgage
$200,000
Interest Rate
6.55%
Mortgage Type
Purchase Money Mortgage
Create a Home Valuation Report for This Property
The Home Valuation Report is an in-depth analysis detailing your home's value as well as a comparison with similar homes in the area
Home Values in the Area
Average Home Value in this Area
Purchase History
| Date | Buyer | Sale Price | Title Company |
|---|---|---|---|
| Anderson Ft | -- | -- | |
| Murphy Kathleen A | $410,000 | -- |
Source: Public Records
Mortgage History
| Date | Status | Borrower | Loan Amount |
|---|---|---|---|
| Previous Owner | Murphy Kathleen A | $200,000 |
Source: Public Records
Tax History Compared to Growth
Tax History
| Year | Tax Paid | Tax Assessment Tax Assessment Total Assessment is a certain percentage of the fair market value that is determined by local assessors to be the total taxable value of land and additions on the property. | Land | Improvement |
|---|---|---|---|---|
| 2025 | $6,075 | $601,500 | $238,200 | $363,300 |
| 2024 | $5,857 | $570,300 | $226,900 | $343,400 |
| 2023 | $5,721 | $547,500 | $229,200 | $318,300 |
| 2022 | $5,587 | $487,500 | $212,300 | $275,200 |
| 2021 | $5,378 | $458,100 | $212,300 | $245,800 |
| 2020 | $5,254 | $440,800 | $212,300 | $228,500 |
| 2019 | $5,126 | $422,900 | $204,100 | $218,800 |
| 2018 | $5,004 | $400,300 | $194,400 | $205,900 |
| 2017 | $4,886 | $381,400 | $185,100 | $196,300 |
| 2016 | $4,182 | $326,700 | $178,000 | $148,700 |
| 2015 | $4,074 | $315,800 | $178,000 | $137,800 |
| 2014 | $3,933 | $295,700 | $165,700 | $130,000 |
Source: Public Records
Map
Nearby Homes
- 193 Randolph St
- 211 Randolph St
- 24 Fisher Rd
- 68 Massapoag St Unit 7
- 120 Randolph St
- 16 Jay Rd
- 308 Forest St
- 50 Hollis St
- 354 Tilden Commons Ln
- 175 Tyson Commons Ln
- 134 Tyson Commons Ln
- 92 Mercury St
- 30 Bradford Commons Ln
- 18 Fountain Ln Unit 2
- 27 Park Ave
- 2 Mitchell Ln Unit B
- 262 West St
- 255 West St
- 11 Woodcrest Ct Unit 5
- 10 Woodcrest Ct Unit 4