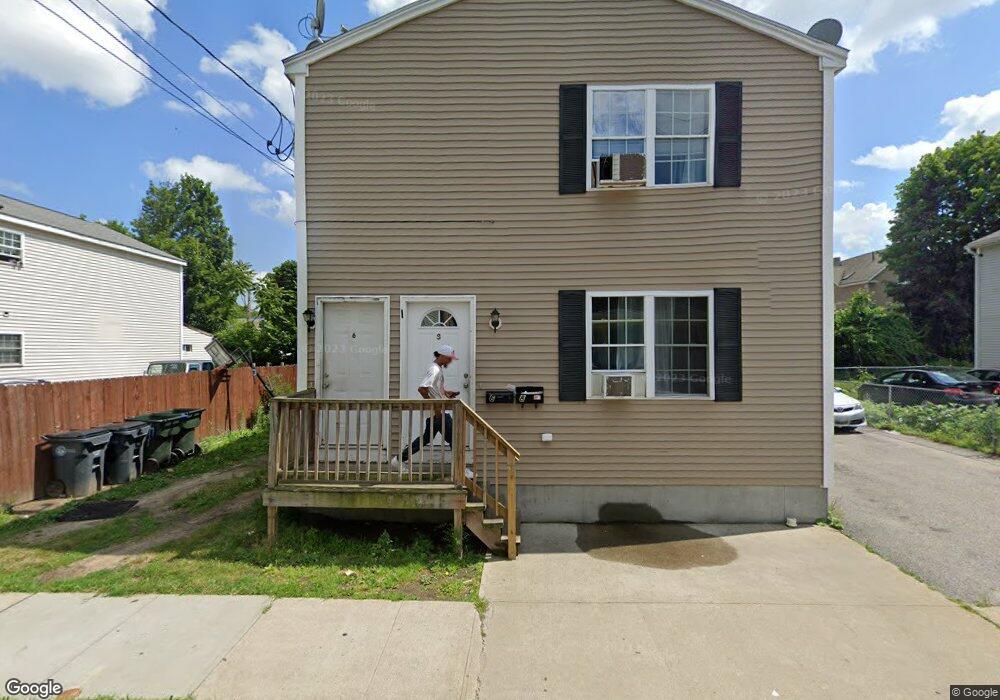
6 Massie Ave Providence, RI 02905
Lower South Providence NeighborhoodEstimated Value: $498,038 - $613,000
6
Beds
2
Baths
2,112
Sq Ft
$261/Sq Ft
Est. Value
About This Home
This home is located at 6 Massie Ave, Providence, RI 02905 and is currently estimated at $552,260, approximately $261 per square foot. 6 Massie Ave is a home located in Providence County with nearby schools including Highlander Charter School and Bishop Mcvinney Elementary School.
Ownership History
Date
Name
Owned For
Owner Type
Purchase Details
Closed on
Apr 25, 2022
Sold by
Malena-Figari Leonte A and Tucent Diego M
Bought by
Tucent Diego M
Current Estimated Value
Home Financials for this Owner
Home Financials are based on the most recent Mortgage that was taken out on this home.
Original Mortgage
$309,320
Outstanding Balance
$288,841
Interest Rate
3.87%
Mortgage Type
FHA
Estimated Equity
$263,419
Purchase Details
Closed on
May 11, 2020
Sold by
Costa Michael
Bought by
Malena-Figari Leonte A and Malena-Tucent Diego
Home Financials for this Owner
Home Financials are based on the most recent Mortgage that was taken out on this home.
Original Mortgage
$262,163
Interest Rate
4.25%
Mortgage Type
FHA
Create a Home Valuation Report for This Property
The Home Valuation Report is an in-depth analysis detailing your home's value as well as a comparison with similar homes in the area
Home Values in the Area
Average Home Value in this Area
Purchase History
| Date | Buyer | Sale Price | Title Company |
|---|---|---|---|
| Tucent Diego M | -- | None Available | |
| Tucent Diego M | -- | None Available | |
| Tucent Diego M | -- | None Available | |
| Malena-Figari Leonte A | $267,000 | None Available | |
| Malena-Figari Leonte A | $267,000 | None Available | |
| Malena-Figari Leonte A | $267,000 | None Available |
Source: Public Records
Mortgage History
| Date | Status | Borrower | Loan Amount |
|---|---|---|---|
| Open | Tucent Diego M | $309,320 | |
| Closed | Tucent Diego M | $309,320 | |
| Previous Owner | Malena-Figari Leonte A | $262,163 |
Source: Public Records
Tax History
| Year | Tax Paid | Tax Assessment Tax Assessment Total Assessment is a certain percentage of the fair market value that is determined by local assessors to be the total taxable value of land and additions on the property. | Land | Improvement |
|---|---|---|---|---|
| 2025 | $3,900 | $516,500 | $121,700 | $394,800 |
| 2024 | $6,722 | $366,300 | $77,100 | $289,200 |
| 2023 | $6,722 | $366,300 | $77,100 | $289,200 |
| 2022 | $6,520 | $366,300 | $77,100 | $289,200 |
| 2021 | $5,634 | $229,400 | $35,500 | $193,900 |
| 2020 | $5,634 | $229,400 | $35,500 | $193,900 |
| 2019 | $5,634 | $229,400 | $35,500 | $193,900 |
| 2018 | $5,114 | $160,000 | $32,300 | $127,700 |
| 2017 | $5,114 | $160,000 | $32,300 | $127,700 |
| 2016 | $5,114 | $160,000 | $32,300 | $127,700 |
| 2015 | $4,664 | $140,900 | $32,300 | $108,600 |
| 2014 | $4,755 | $140,900 | $32,300 | $108,600 |
| 2013 | $4,755 | $140,900 | $32,300 | $108,600 |
Source: Public Records
Map
Nearby Homes
- 143 Houston St
- 136 Houston St
- 8 Atlantic Ave
- 296 Potters Ave
- 38 Mitchell St
- 171 Reynolds Ave
- 462 Prairie Ave
- 155 Burnside St
- 99 Colfax St
- 87 Gallup St
- 14 Burnside St
- 186 Oxford St
- 71 Colfax St
- 24 Reynolds Ave
- 61 Stanwood St
- 20 Pennsylvania Ave
- 182 Ocean St
- 3 Mount Vernon St
- 6 Warrington St
- 218 Hamilton St
Your Personal Tour Guide
Ask me questions while you tour the home.