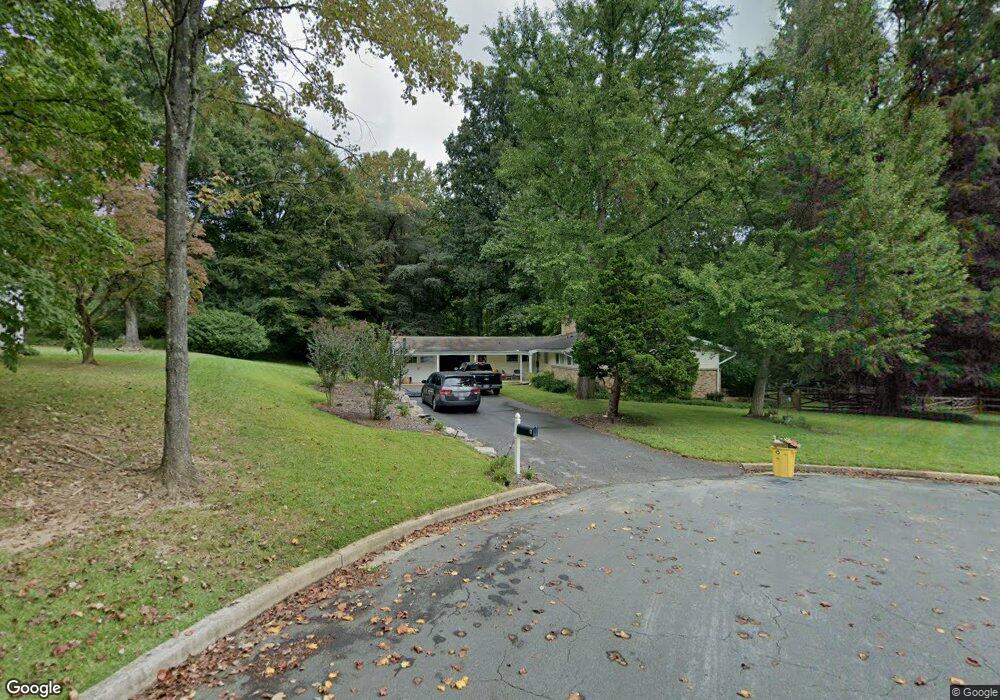
6 Midcrest Ct Towson, MD 21286
Hampton NeighborhoodEstimated Value: $683,895 - $854,000
4
Beds
3
Baths
3,624
Sq Ft
$207/Sq Ft
Est. Value
About This Home
This home is located at 6 Midcrest Ct, Towson, MD 21286 and is currently estimated at $751,724, approximately $207 per square foot. 6 Midcrest Ct is a home located in Baltimore County with nearby schools including Hampton Elementary, Ridgely Middle, and Loch Raven High.
Ownership History
Date
Name
Owned For
Owner Type
Purchase Details
Closed on
Dec 9, 2011
Sold by
Sorice Rebecca B and Sorice Cory J
Bought by
Ill Todd R and Ill Cheryl R
Current Estimated Value
Home Financials for this Owner
Home Financials are based on the most recent Mortgage that was taken out on this home.
Original Mortgage
$373,600
Outstanding Balance
$255,322
Interest Rate
3.99%
Mortgage Type
Purchase Money Mortgage
Estimated Equity
$496,402
Purchase Details
Closed on
Dec 4, 2000
Sold by
Schenck John E
Bought by
Sorice Rebecca B and Sorice Cory J
Purchase Details
Closed on
Sep 2, 1993
Sold by
Gordon
Bought by
Schenck John E
Home Financials for this Owner
Home Financials are based on the most recent Mortgage that was taken out on this home.
Original Mortgage
$150,000
Interest Rate
7.11%
Create a Home Valuation Report for This Property
The Home Valuation Report is an in-depth analysis detailing your home's value as well as a comparison with similar homes in the area
Home Values in the Area
Average Home Value in this Area
Purchase History
| Date | Buyer | Sale Price | Title Company |
|---|---|---|---|
| Ill Todd R | $467,000 | Chicago Title Insurance Comp | |
| Sorice Rebecca B | $290,000 | -- | |
| Schenck John E | $219,500 | -- |
Source: Public Records
Mortgage History
| Date | Status | Borrower | Loan Amount |
|---|---|---|---|
| Open | Ill Todd R | $373,600 | |
| Previous Owner | Schenck John E | $150,000 |
Source: Public Records
Tax History
| Year | Tax Paid | Tax Assessment Tax Assessment Total Assessment is a certain percentage of the fair market value that is determined by local assessors to be the total taxable value of land and additions on the property. | Land | Improvement |
|---|---|---|---|---|
| 2025 | $5,534 | $496,300 | $147,200 | $349,100 |
| 2024 | $5,534 | $462,833 | $0 | $0 |
| 2023 | $2,663 | $429,367 | $0 | $0 |
| 2022 | $5,059 | $395,900 | $119,100 | $276,800 |
| 2021 | $5,040 | $394,633 | $0 | $0 |
| 2020 | $5,040 | $393,367 | $0 | $0 |
| 2019 | $5,005 | $392,100 | $119,100 | $273,000 |
| 2018 | $4,875 | $382,800 | $0 | $0 |
| 2017 | $4,683 | $373,500 | $0 | $0 |
| 2016 | $4,115 | $364,200 | $0 | $0 |
| 2015 | $4,115 | $364,200 | $0 | $0 |
| 2014 | $4,115 | $364,200 | $0 | $0 |
Source: Public Records
Map
Nearby Homes
- 1008 Hart Rd
- 108 Beech Hill Ln
- 901 Dogwood Hill Ct
- 1604 Timberline Ct
- 1107 Cowpens Ave
- 1002 Dunblane Rd
- 1905 Haverhill Rd
- 8820 Littlewood Rd
- 11112 Old Carriage Rd
- 3972 Forest Valley Rd
- 1110 Sleepy Dell Ct
- 23 Roger Valley Ct
- 9 Roger Valley Ct
- 8731 Lackawanna Ave
- 9310 Bellbeck Rd
- 903 Breezewick Cir
- 2213 Lowells Glen Rd Unit 13L
- 9374 Pan Ridge Rd
- 9355 Pan Ridge Rd
- 939 Beaverbank Cir
- 8 Midcrest Ct
- 1019 Timber Trail Rd
- 1023 Timber Trail Rd
- 1017 Timber Trail Rd
- 1021 Timber Trail Rd
- 11 Midcrest Ct
- 1015 Timber Trail Rd
- 9 Midcrest Ct
- 7 Midcrest Ct
- 6 Pickford Ct
- 5 Midcrest Ct
- 4 Pickford Ct
- 3 Midcrest Ct
- 1114 Valewood Rd
- 1101 Timber Trail Rd
- 1008 Timber Trail Rd
- 1010 Timber Trail Rd
- 1112 Valewood Rd
- 1013 Timber Trail Rd
- 1110 Valewood Rd
Your Personal Tour Guide
Ask me questions while you tour the home.