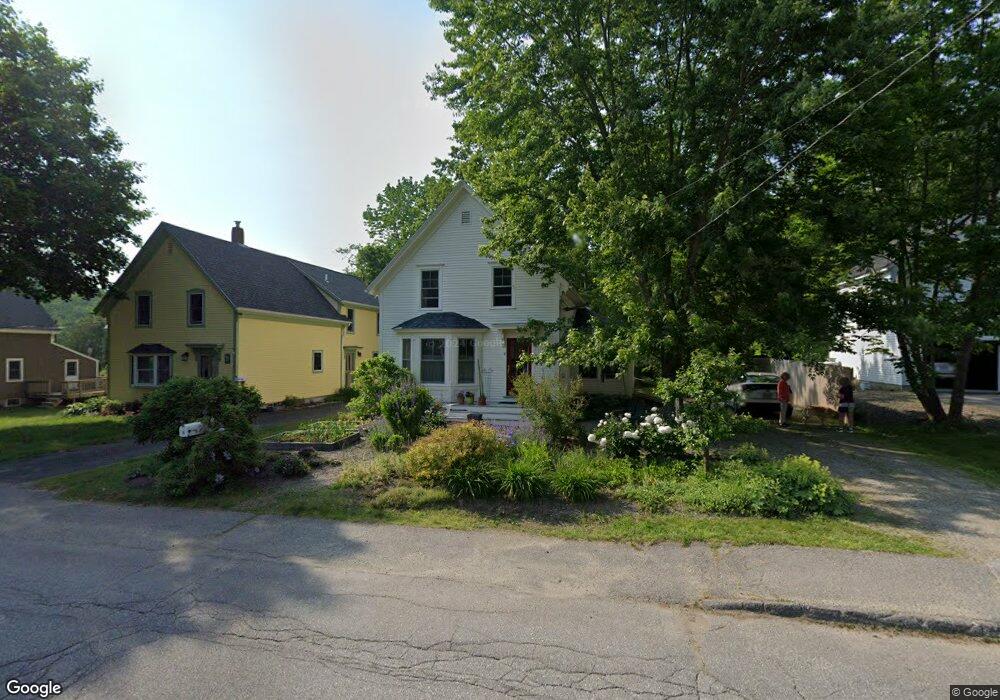
6 Mill St Camden, ME 04843
Estimated Value: $404,000 - $469,000
2
Beds
1
Bath
1,316
Sq Ft
$325/Sq Ft
Est. Value
About This Home
This home is located at 6 Mill St, Camden, ME 04843 and is currently estimated at $427,642, approximately $324 per square foot. 6 Mill St is a home located in Knox County with nearby schools including Camden-Rockport Elementary School, Camden-Rockport Middle School, and Camden Hills Regional High School.
Ownership History
Date
Name
Owned For
Owner Type
Purchase Details
Closed on
Aug 29, 2013
Sold by
Irving Linda A
Bought by
Oldham-Sibley Destry and Head Julia L
Current Estimated Value
Home Financials for this Owner
Home Financials are based on the most recent Mortgage that was taken out on this home.
Original Mortgage
$166,400
Outstanding Balance
$124,173
Interest Rate
4.4%
Mortgage Type
New Conventional
Estimated Equity
$303,469
Purchase Details
Closed on
Jun 11, 2013
Sold by
Christensen Henning
Bought by
Irving Linda
Purchase Details
Closed on
Mar 22, 2012
Sold by
Irving Linda A
Bought by
Christensen Henning
Purchase Details
Closed on
Apr 10, 2007
Sold by
Slack Jeffry V and Costa Rosalind M
Bought by
Irving Linda A
Home Financials for this Owner
Home Financials are based on the most recent Mortgage that was taken out on this home.
Original Mortgage
$207,000
Interest Rate
6.25%
Mortgage Type
Purchase Money Mortgage
Create a Home Valuation Report for This Property
The Home Valuation Report is an in-depth analysis detailing your home's value as well as a comparison with similar homes in the area
Home Values in the Area
Average Home Value in this Area
Purchase History
| Date | Buyer | Sale Price | Title Company |
|---|---|---|---|
| Oldham-Sibley Destry | -- | -- | |
| Irving Linda | -- | -- | |
| Christensen Henning | -- | -- | |
| Irving Linda A | -- | -- |
Source: Public Records
Mortgage History
| Date | Status | Borrower | Loan Amount |
|---|---|---|---|
| Open | Oldham-Sibley Destry | $166,400 | |
| Previous Owner | Irving Linda A | $207,000 |
Source: Public Records
Tax History Compared to Growth
Tax History
| Year | Tax Paid | Tax Assessment Tax Assessment Total Assessment is a certain percentage of the fair market value that is determined by local assessors to be the total taxable value of land and additions on the property. | Land | Improvement |
|---|---|---|---|---|
| 2024 | $3,594 | $342,300 | $96,900 | $245,400 |
| 2023 | $3,674 | $266,200 | $45,100 | $221,100 |
| 2022 | $3,514 | $266,200 | $45,100 | $221,100 |
| 2021 | $2,973 | $193,700 | $39,200 | $154,500 |
| 2020 | $2,911 | $193,700 | $39,200 | $154,500 |
| 2019 | $2,888 | $193,700 | $39,200 | $154,500 |
| 2018 | $2,891 | $194,300 | $40,900 | $153,400 |
| 2017 | $2,794 | $194,300 | $40,900 | $153,400 |
| 2016 | $2,602 | $166,900 | $48,000 | $118,900 |
| 2015 | $2,525 | $166,900 | $48,000 | $118,900 |
| 2014 | $2,408 | $166,900 | $48,000 | $118,900 |
| 2013 | $2,343 | $166,900 | $48,000 | $118,900 |
Source: Public Records
Map
Nearby Homes