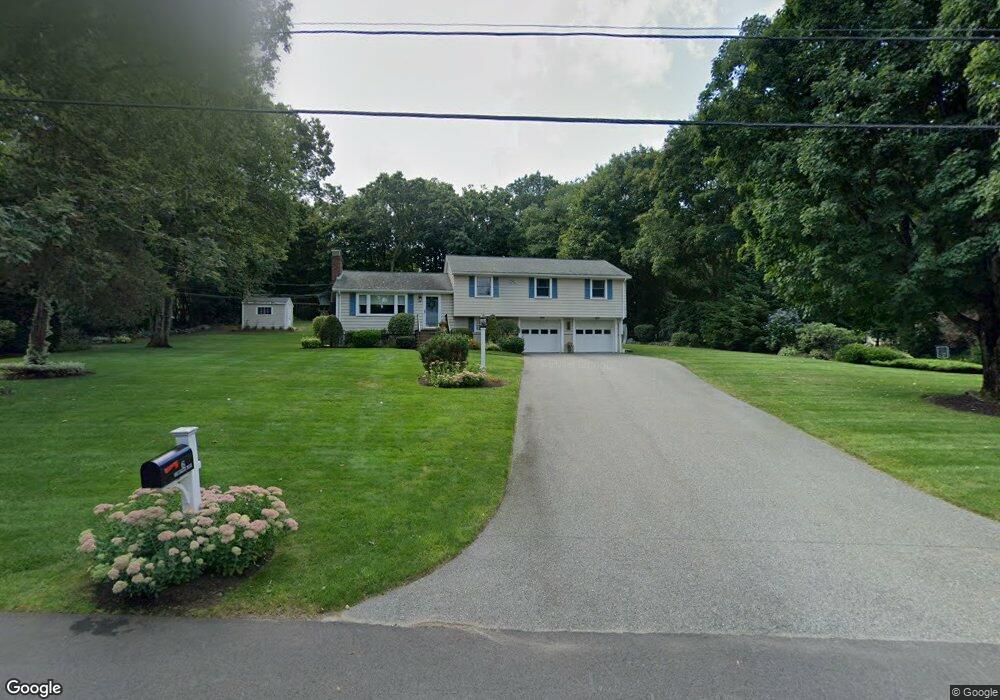
6 Millbrook Rd Lexington, MA 02420
North Lexington NeighborhoodEstimated Value: $1,890,000 - $5,023,000
4
Beds
3
Baths
1,744
Sq Ft
$2,204/Sq Ft
Est. Value
About This Home
This home is located at 6 Millbrook Rd, Lexington, MA 02420 and is currently estimated at $3,843,121, approximately $2,203 per square foot. 6 Millbrook Rd is a home located in Middlesex County with nearby schools including Fiske Elementary School, William Diamond Middle School, and Lexington High School.
Ownership History
Date
Name
Owned For
Owner Type
Purchase Details
Closed on
Jun 3, 2022
Sold by
Hbc Llc
Bought by
Chelian Suren and Thakore Vihangi
Current Estimated Value
Home Financials for this Owner
Home Financials are based on the most recent Mortgage that was taken out on this home.
Original Mortgage
$2,868,000
Outstanding Balance
$2,704,983
Interest Rate
5.11%
Mortgage Type
Purchase Money Mortgage
Estimated Equity
$1,138,138
Purchase Details
Closed on
Nov 16, 2020
Sold by
Macdonald Kathleen A and Abair Suzanne D
Bought by
Hbc Llc
Purchase Details
Closed on
May 16, 2005
Sold by
Coscia Heidi E and Coscia John V
Bought by
Macdonald Kathleen A and Abair Suzanne D
Home Financials for this Owner
Home Financials are based on the most recent Mortgage that was taken out on this home.
Original Mortgage
$635,000
Interest Rate
6.05%
Mortgage Type
Purchase Money Mortgage
Create a Home Valuation Report for This Property
The Home Valuation Report is an in-depth analysis detailing your home's value as well as a comparison with similar homes in the area
Home Values in the Area
Average Home Value in this Area
Purchase History
| Date | Buyer | Sale Price | Title Company |
|---|---|---|---|
| Chelian Suren | $3,738,134 | None Available | |
| Hbc Llc | $1,150,000 | None Available | |
| Hbc Llc | $1,150,000 | None Available | |
| Macdonald Kathleen A | $975,000 | -- | |
| Macdonald Kathleen A | $975,000 | -- |
Source: Public Records
Mortgage History
| Date | Status | Borrower | Loan Amount |
|---|---|---|---|
| Open | Chelian Suren | $2,868,000 | |
| Previous Owner | Macdonald Kathleen A | $523,750 | |
| Previous Owner | Macdonald Kathleen A | $54,000 | |
| Previous Owner | Macdonald Kathleen A | $635,000 |
Source: Public Records
Tax History
| Year | Tax Paid | Tax Assessment Tax Assessment Total Assessment is a certain percentage of the fair market value that is determined by local assessors to be the total taxable value of land and additions on the property. | Land | Improvement |
|---|---|---|---|---|
| 2025 | $53,983 | $4,414,000 | $942,000 | $3,472,000 |
| 2024 | $52,467 | $4,283,000 | $898,000 | $3,385,000 |
| 2023 | $48,893 | $3,761,000 | $817,000 | $2,944,000 |
| 2022 | $19,003 | $1,377,000 | $635,000 | $742,000 |
| 2021 | $15,167 | $1,054,000 | $605,000 | $449,000 |
| 2020 | $15,076 | $1,073,000 | $605,000 | $468,000 |
| 2019 | $14,487 | $1,026,000 | $576,000 | $450,000 |
| 2018 | $14,171 | $991,000 | $549,000 | $442,000 |
| 2017 | $14,200 | $980,000 | $523,000 | $457,000 |
| 2016 | $13,636 | $934,000 | $499,000 | $435,000 |
| 2015 | $12,988 | $874,000 | $453,000 | $421,000 |
| 2014 | $13,354 | $861,000 | $412,000 | $449,000 |
Source: Public Records
Map
Nearby Homes
- 93 Adams St
- 4 Myrna Rd
- 197 Grant St
- 23 Burroughs Rd
- 36 Adams St
- 23 Thoreau Rd
- 57 Colony Rd
- 4 Whittier Rd
- 4 Northgate Cir
- 18 Victory Garden Way
- 25 Flintlock Rd
- 3a Nowers Rd
- 58 Hancock St
- 17 Hamilton Rd
- 47 Ledgelawn Ave
- 109 Simonds Rd
- 32 Edgewood Rd Unit 3
- 32 Edgewood Rd Unit 1
- 10 Preston Rd
- 93 Bedford St Unit 201
Your Personal Tour Guide
Ask me questions while you tour the home.