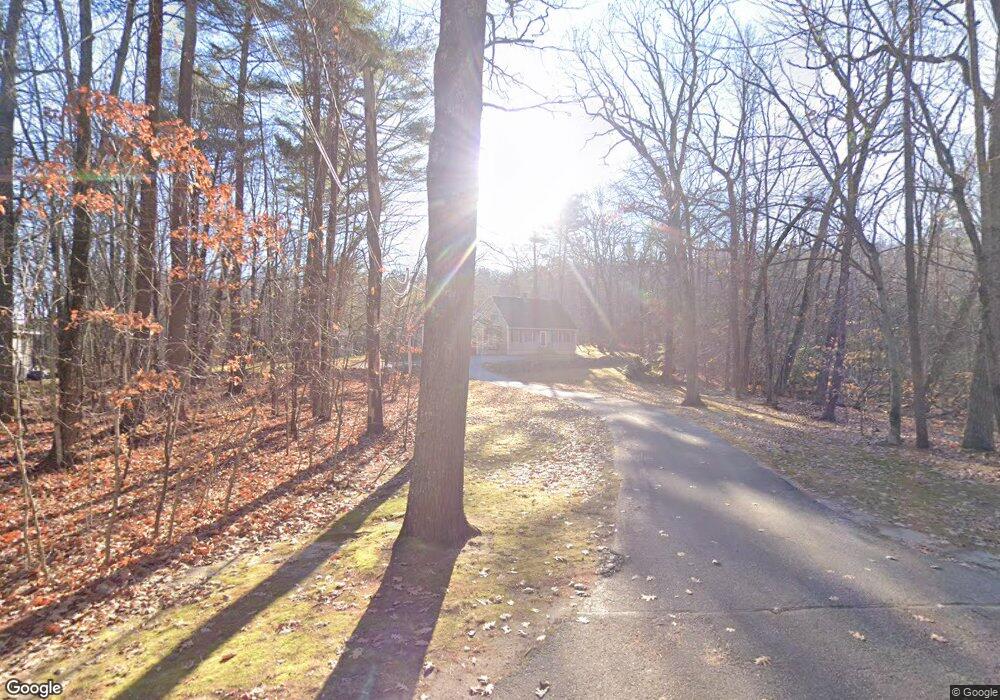
6 Mineral Spring Rd Windham, ME 04062
Estimated Value: $535,000 - $593,000
3
Beds
2
Baths
1,778
Sq Ft
$315/Sq Ft
Est. Value
About This Home
This home is located at 6 Mineral Spring Rd, Windham, ME 04062 and is currently estimated at $560,548, approximately $315 per square foot. 6 Mineral Spring Rd is a home located in Cumberland County with nearby schools including Manchester School, Windham Primary School, and Windham Middle School.
Ownership History
Date
Name
Owned For
Owner Type
Purchase Details
Closed on
Feb 27, 2009
Sold by
Bank Of New York Mellon
Bought by
Hurlburt Allison M and Hurlburt Christopher
Current Estimated Value
Home Financials for this Owner
Home Financials are based on the most recent Mortgage that was taken out on this home.
Original Mortgage
$170,900
Outstanding Balance
$105,560
Interest Rate
5%
Mortgage Type
Purchase Money Mortgage
Estimated Equity
$454,988
Purchase Details
Closed on
May 17, 2006
Sold by
Weymouth Christine M and Weymouth David L
Bought by
Quincy Irene
Purchase Details
Closed on
May 8, 2006
Sold by
Primacy Closing Corp
Bought by
Weymouth David and Weymouth Christine
Create a Home Valuation Report for This Property
The Home Valuation Report is an in-depth analysis detailing your home's value as well as a comparison with similar homes in the area
Home Values in the Area
Average Home Value in this Area
Purchase History
| Date | Buyer | Sale Price | Title Company |
|---|---|---|---|
| Hurlburt Allison M | $189,900 | -- | |
| Quincy Irene | -- | -- | |
| Weymouth David | -- | -- |
Source: Public Records
Mortgage History
| Date | Status | Borrower | Loan Amount |
|---|---|---|---|
| Open | Hurlburt Allison M | $170,900 |
Source: Public Records
Tax History
| Year | Tax Paid | Tax Assessment Tax Assessment Total Assessment is a certain percentage of the fair market value that is determined by local assessors to be the total taxable value of land and additions on the property. | Land | Improvement |
|---|---|---|---|---|
| 2025 | $5,487 | $455,000 | $131,000 | $324,000 |
| 2024 | $5,219 | $455,000 | $131,000 | $324,000 |
| 2023 | $4,835 | $431,700 | $121,800 | $309,900 |
| 2022 | $4,455 | $383,700 | $108,100 | $275,600 |
| 2021 | $4,002 | $317,600 | $94,000 | $223,600 |
| 2020 | $4,178 | $278,500 | $82,500 | $196,000 |
| 2019 | $4,077 | $278,500 | $82,500 | $196,000 |
| 2018 | $3,889 | $256,200 | $74,600 | $181,600 |
| 2017 | $3,859 | $234,900 | $66,700 | $168,200 |
| 2016 | $3,688 | $234,900 | $66,700 | $168,200 |
| 2015 | $3,559 | $234,900 | $66,700 | $168,200 |
| 2014 | $3,299 | $234,900 | $66,700 | $168,200 |
| 2013 | -- | $234,900 | $66,700 | $168,200 |
Source: Public Records
Map
Nearby Homes
- 1042 Roosevelt Trail
- 96 Mineral Spring Rd
- 99 Enterprise Dr
- 1083 Roosevelt Trail
- lot #8 Bedrock Terrace
- 1112 Roosevelt Trail Unit 8
- 39 Pipeline Rd
- 20 Bittersweet Way
- 34 Trails End Rd
- 16 Peterson Rd
- 72 Sand Beach Rd
- 103 Basin Rd
- 194 Hearthside Rd
- 114 Wild Acres Rd
- 10 Abby Rd
- 36 Whittemore Cove Rd
- 1 Matinicus Way Unit 1
- 75 Tandberg Trail
- 5 Sandbar Rd
- 14 Sabbady Point Rd
- 2 Mineral Spring Rd
- 1 Red Hawk Dr
- 5 Red Hawk Dr
- 85 Mineral Spring Rd
- 9 Mineral Spring Rd
- 9 Red Hawk Dr
- 1027 Roosevelt Trail
- 21 Mineral Spring Rd
- 1029 Roosevelt Trail
- 113 Linnell Rd
- 13 Red Hawk Dr
- 5 Hemlock Dr
- 10 Hemlock Dr
- 10 Hemlock Lot# 107
- 10 Hemlock Drive Lot#107
- 25 Linnell Rd
- 9 Sleepy Hollow Rd
- 1037 Roosevelt Trail
- 20 Hemlock Dr
- 17 Red Hawk Dr
Your Personal Tour Guide
Ask me questions while you tour the home.