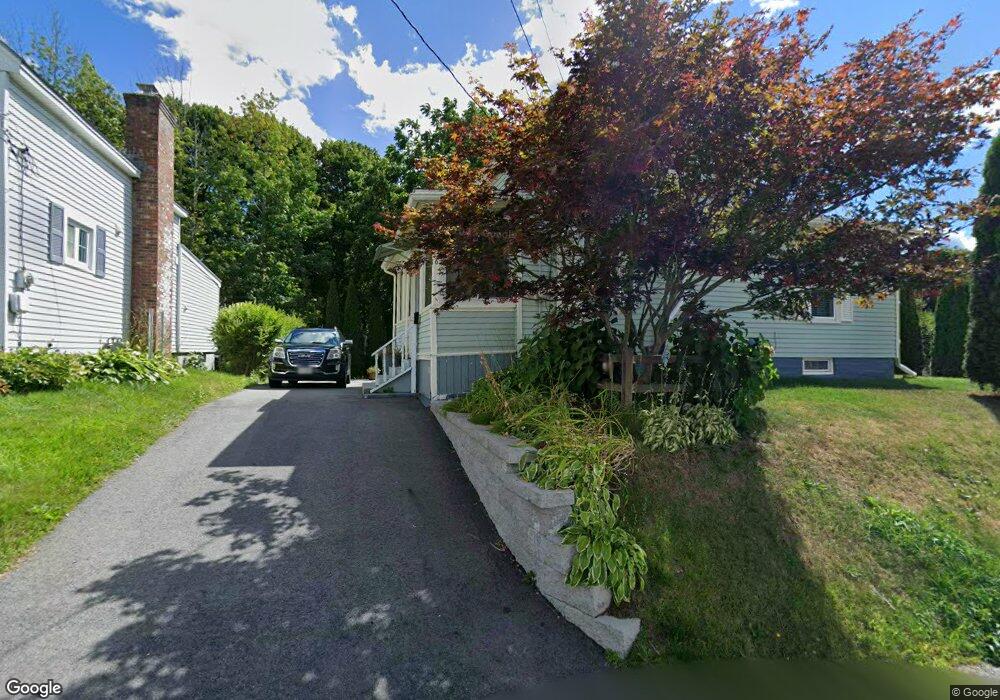
6 Moran St Gardner, MA 01440
Estimated Value: $290,000 - $308,000
2
Beds
1
Bath
893
Sq Ft
$335/Sq Ft
Est. Value
About This Home
This home is located at 6 Moran St, Gardner, MA 01440 and is currently estimated at $299,273, approximately $335 per square foot. 6 Moran St is a home located in Worcester County with nearby schools including Gardner High School, Holy Family Academy, and Wachusett Hills Christian School.
Ownership History
Date
Name
Owned For
Owner Type
Purchase Details
Closed on
Jul 8, 2014
Sold by
Gilliland Denise D
Bought by
Arsenault Renay
Current Estimated Value
Home Financials for this Owner
Home Financials are based on the most recent Mortgage that was taken out on this home.
Original Mortgage
$131,277
Outstanding Balance
$96,924
Interest Rate
3.75%
Mortgage Type
FHA
Estimated Equity
$202,349
Purchase Details
Closed on
Feb 23, 2011
Sold by
Fnma
Bought by
Bank Of America Na
Purchase Details
Closed on
Apr 2, 2010
Sold by
Jocol Elmer
Bought by
Federal National Mortgage Association
Purchase Details
Closed on
Oct 9, 2003
Sold by
Lheureux David L and Lheureux Jessie E
Bought by
Jocol Elmer and Jocol Hilda
Home Financials for this Owner
Home Financials are based on the most recent Mortgage that was taken out on this home.
Original Mortgage
$63,750
Interest Rate
6.35%
Mortgage Type
Purchase Money Mortgage
Create a Home Valuation Report for This Property
The Home Valuation Report is an in-depth analysis detailing your home's value as well as a comparison with similar homes in the area
Home Values in the Area
Average Home Value in this Area
Purchase History
| Date | Buyer | Sale Price | Title Company |
|---|---|---|---|
| Arsenault Renay | $133,700 | -- | |
| Bank Of America Na | -- | -- | |
| Federal National Mortgage Association | $155,627 | -- | |
| Jocol Elmer | $85,000 | -- |
Source: Public Records
Mortgage History
| Date | Status | Borrower | Loan Amount |
|---|---|---|---|
| Open | Arsenault Renay | $131,277 | |
| Previous Owner | Jocol Elmer | $63,750 |
Source: Public Records
Tax History
| Year | Tax Paid | Tax Assessment Tax Assessment Total Assessment is a certain percentage of the fair market value that is determined by local assessors to be the total taxable value of land and additions on the property. | Land | Improvement |
|---|---|---|---|---|
| 2025 | $40 | $280,500 | $66,400 | $214,100 |
| 2024 | $3,867 | $258,000 | $60,400 | $197,600 |
| 2023 | $3,723 | $230,800 | $59,500 | $171,300 |
| 2022 | $3,426 | $184,300 | $45,100 | $139,200 |
| 2021 | $3,281 | $163,700 | $39,200 | $124,500 |
| 2020 | $3,135 | $158,800 | $39,200 | $119,600 |
| 2019 | $2,977 | $147,800 | $39,200 | $108,600 |
| 2018 | $2,751 | $135,700 | $39,200 | $96,500 |
| 2017 | $2,804 | $136,900 | $39,200 | $97,700 |
| 2016 | $2,604 | $127,200 | $39,200 | $88,000 |
| 2015 | $2,330 | $116,600 | $39,200 | $77,400 |
| 2014 | $2,300 | $121,900 | $43,500 | $78,400 |
Source: Public Records
Map
Nearby Homes
Your Personal Tour Guide
Ask me questions while you tour the home.