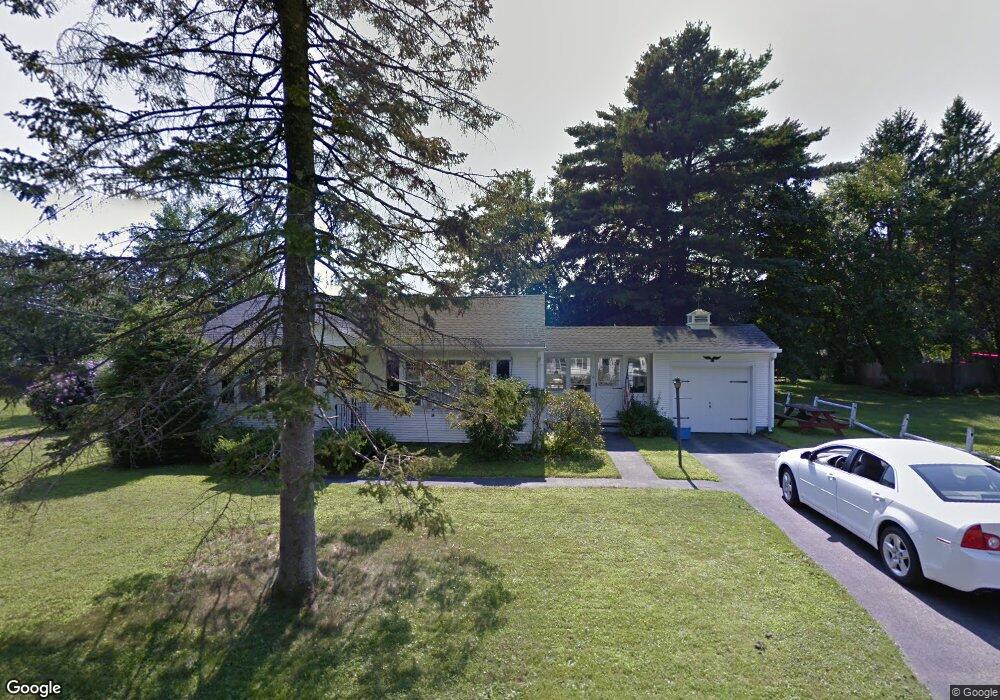
6 Mulberry Ln Unit 1 Northborough, MA 01532
Estimated Value: $432,000 - $460,000
2
Beds
1
Bath
816
Sq Ft
$547/Sq Ft
Est. Value
About This Home
This home is located at 6 Mulberry Ln Unit 1, Northborough, MA 01532 and is currently estimated at $446,641, approximately $547 per square foot. 6 Mulberry Ln Unit 1 is a home located in Worcester County with nearby schools including Lincoln Street Elementary School, Robert E. Melican Middle School, and Algonquin Regional High School.
Ownership History
Date
Name
Owned For
Owner Type
Purchase Details
Closed on
Jun 29, 2016
Sold by
Flint Robert M
Bought by
Stickney Emily
Current Estimated Value
Home Financials for this Owner
Home Financials are based on the most recent Mortgage that was taken out on this home.
Original Mortgage
$178,400
Outstanding Balance
$139,694
Interest Rate
3%
Mortgage Type
Adjustable Rate Mortgage/ARM
Estimated Equity
$306,947
Purchase Details
Closed on
Jun 3, 2010
Sold by
Flint Robert M and Lantange Janet C
Bought by
Flint Robert M
Purchase Details
Closed on
Jul 7, 1999
Sold by
Est Brady Grace M and Brady Edward N
Bought by
Flint Robert M and Lantange Janet C
Create a Home Valuation Report for This Property
The Home Valuation Report is an in-depth analysis detailing your home's value as well as a comparison with similar homes in the area
Home Values in the Area
Average Home Value in this Area
Purchase History
| Date | Buyer | Sale Price | Title Company |
|---|---|---|---|
| Stickney Emily | $223,000 | -- | |
| Flint Robert M | -- | -- | |
| Flint Robert M | $149,500 | -- |
Source: Public Records
Mortgage History
| Date | Status | Borrower | Loan Amount |
|---|---|---|---|
| Open | Stickney Emily | $178,400 |
Source: Public Records
Tax History Compared to Growth
Tax History
| Year | Tax Paid | Tax Assessment Tax Assessment Total Assessment is a certain percentage of the fair market value that is determined by local assessors to be the total taxable value of land and additions on the property. | Land | Improvement |
|---|---|---|---|---|
| 2025 | $5,898 | $413,900 | $250,300 | $163,600 |
| 2024 | $5,181 | $362,800 | $207,500 | $155,300 |
| 2023 | $5,225 | $353,300 | $195,900 | $157,400 |
| 2022 | $5,173 | $313,700 | $186,500 | $127,200 |
| 2021 | $4,934 | $288,200 | $169,400 | $118,800 |
| 2020 | $4,959 | $287,500 | $169,400 | $118,100 |
| 2019 | $4,715 | $274,900 | $164,300 | $110,600 |
| 2018 | $4,494 | $258,400 | $161,200 | $97,200 |
| 2017 | $4,339 | $249,500 | $161,200 | $88,300 |
| 2016 | $4,200 | $244,600 | $157,900 | $86,700 |
| 2015 | $3,831 | $229,000 | $156,200 | $72,800 |
| 2014 | $3,713 | $223,800 | $156,200 | $67,600 |
Source: Public Records
Map
Nearby Homes
- 39 Pleasant St Unit A6
- 39 Pleasant St Unit B19
- 39 Pleasant St Unit C5
- 21 Pleasant St
- 90 W Main St
- 89 W Main St
- 105 Lincoln St
- 97 Howard St
- 19 Crestwood Dr Unit 19
- 14 Mill St
- 5 Swan View Common Dr
- 4 Country Candle Ln Unit 4
- 86 Whitney St
- 23 Valentine Rd
- 71 Summer St
- 85 Hudson St Unit 87
- 85 Hudson St Unit 85
- 81 West St
- 6 Silas Dr
- 59 School St Unit B-8
- 6 Mulberry Ln
- 5 Mulberry Ln
- 9 Mulberry Ln
- 61 Pleasant St
- 71 Pleasant St
- 57 Pleasant St
- 67 Pleasant St
- 10 Capt John Edwards Dr
- 6 Capt John Edwards Dr
- 10 John Edward Dr
- 19 Prospect St
- 10 Prospect St
- 6 Prospect St
- 14 John Edward Dr
- 2 Prospect St
- 53 Pleasant St
- 14 Capt John Edwards Dr
- 15 Prospect St
- 15 Prospect St Unit 1
- 73 Pleasant St