6 N Central Ave Bridgeton, NJ 08302
Maurice River NeighborhoodEstimated Value: $136,000 - $280,000
--
Bed
--
Bath
924
Sq Ft
$195/Sq Ft
Est. Value
About This Home
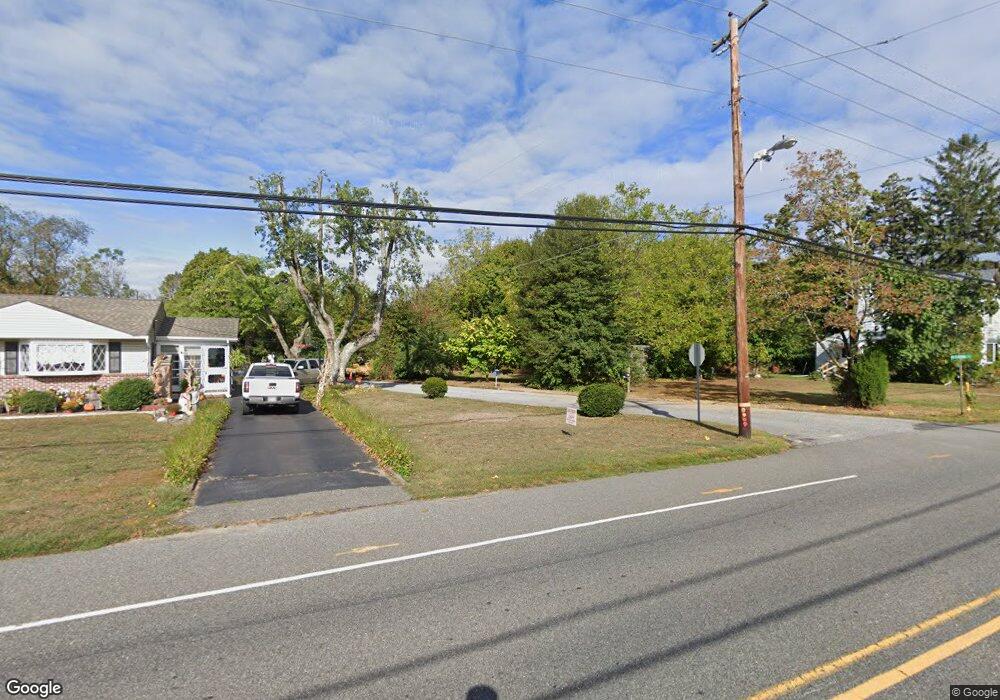
This home is located at 6 N Central Ave, Bridgeton, NJ 08302 and is currently estimated at $180,492, approximately $195 per square foot. 6 N Central Ave is a home with nearby schools including Maurice River Township Elementary School.
Ownership History
Date
Name
Owned For
Owner Type
Purchase Details
Closed on
Sep 24, 2004
Sold by
Slaughter Christina L
Bought by
Gunzenhouser John E and Gunzenhouser Karen
Current Estimated Value
Home Financials for this Owner
Home Financials are based on the most recent Mortgage that was taken out on this home.
Original Mortgage
$51,550
Outstanding Balance
$25,735
Interest Rate
5.89%
Estimated Equity
$154,757
Purchase Details
Closed on
Oct 3, 1997
Sold by
Cossaboon John
Bought by
Canup Robt C
Purchase Details
Closed on
Apr 11, 1996
Sold by
Hoffman Ronald and Hoffman Stormi R
Bought by
Cossaboon John L
Create a Home Valuation Report for This Property
The Home Valuation Report is an in-depth analysis detailing your home's value as well as a comparison with similar homes in the area
Home Values in the Area
Average Home Value in this Area
Purchase History
| Date | Buyer | Sale Price | Title Company |
|---|---|---|---|
| Gunzenhouser John E | $52,000 | -- | |
| Canup Robt C | $45,000 | -- | |
| Cossaboon John L | -- | Dominion Title Services Inc |
Source: Public Records
Mortgage History
| Date | Status | Borrower | Loan Amount |
|---|---|---|---|
| Open | Gunzenhouser John E | $51,550 |
Source: Public Records
Tax History Compared to Growth
Tax History
| Year | Tax Paid | Tax Assessment Tax Assessment Total Assessment is a certain percentage of the fair market value that is determined by local assessors to be the total taxable value of land and additions on the property. | Land | Improvement |
|---|---|---|---|---|
| 2025 | $2,605 | $87,000 | $36,700 | $50,300 |
| 2024 | $2,605 | $87,000 | $36,700 | $50,300 |
| 2023 | $2,639 | $87,000 | $36,700 | $50,300 |
| 2022 | $2,636 | $87,000 | $36,700 | $50,300 |
| 2021 | $2,575 | $87,000 | $36,700 | $50,300 |
| 2020 | $2,568 | $87,000 | $36,700 | $50,300 |
| 2019 | $2,512 | $87,000 | $36,700 | $50,300 |
| 2018 | $2,438 | $87,000 | $36,700 | $50,300 |
| 2017 | $2,425 | $87,000 | $36,700 | $50,300 |
| 2016 | $2,359 | $87,000 | $36,700 | $50,300 |
| 2015 | $2,328 | $87,000 | $36,700 | $50,300 |
| 2014 | $2,279 | $87,000 | $36,700 | $50,300 |
Source: Public Records
Map
Nearby Homes