Estimated Value: $762,000 - $1,096,000
4
Beds
3
Baths
2,064
Sq Ft
$430/Sq Ft
Est. Value
About This Home
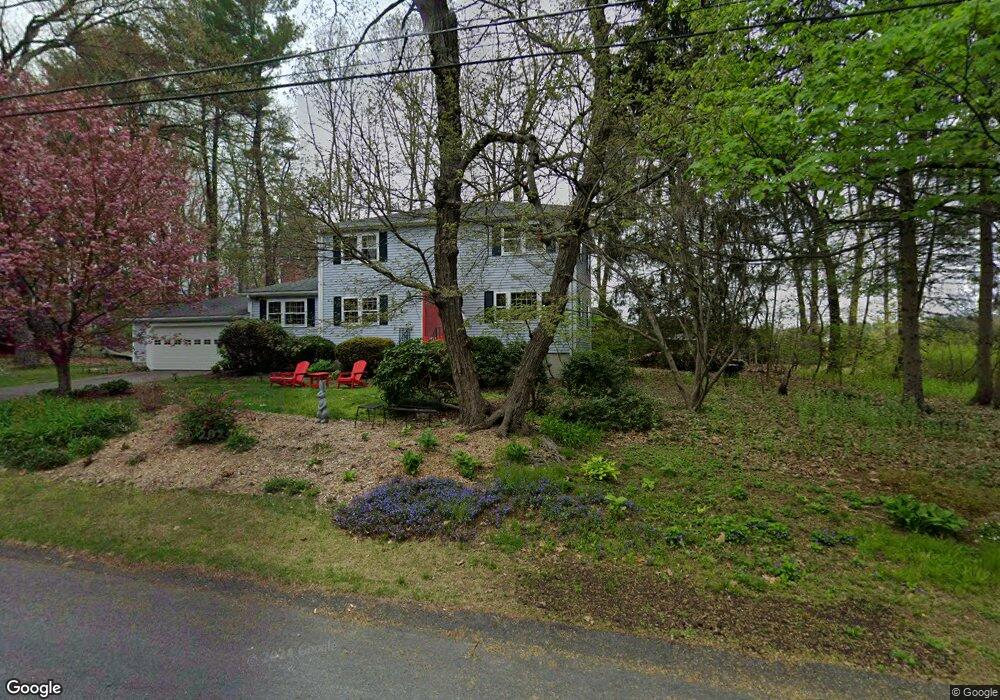
This home is located at 6 Nadine Rd, Acton, MA 01720 and is currently estimated at $887,277, approximately $429 per square foot. 6 Nadine Rd is a home located in Middlesex County with nearby schools including Acton-Boxborough Regional High School, Maynard Knowledge Beginnings, and The Imago School.
Ownership History
Date
Name
Owned For
Owner Type
Purchase Details
Closed on
Jun 26, 2024
Sold by
Jones Peter R and Jones Maureen A
Bought by
Shirley-Jones Maureen A
Current Estimated Value
Home Financials for this Owner
Home Financials are based on the most recent Mortgage that was taken out on this home.
Original Mortgage
$146,900
Outstanding Balance
$145,159
Interest Rate
7.03%
Mortgage Type
Stand Alone Refi Refinance Of Original Loan
Estimated Equity
$742,118
Purchase Details
Closed on
Sep 12, 1994
Sold by
Mullin Albert E and Mullin Mary E
Bought by
Karp Jeffrey D and Karp Eva L
Home Financials for this Owner
Home Financials are based on the most recent Mortgage that was taken out on this home.
Original Mortgage
$247,500
Interest Rate
8.54%
Mortgage Type
Purchase Money Mortgage
Create a Home Valuation Report for This Property
The Home Valuation Report is an in-depth analysis detailing your home's value as well as a comparison with similar homes in the area
Home Values in the Area
Average Home Value in this Area
Purchase History
| Date | Buyer | Sale Price | Title Company |
|---|---|---|---|
| Shirley-Jones Maureen A | -- | None Available | |
| Shirley-Jones Maureen A | -- | None Available | |
| Karp Jeffrey D | $275,000 | -- |
Source: Public Records
Mortgage History
| Date | Status | Borrower | Loan Amount |
|---|---|---|---|
| Open | Shirley-Jones Maureen A | $146,900 | |
| Closed | Shirley-Jones Maureen A | $146,900 | |
| Previous Owner | Karp Jeffrey D | $25,000 | |
| Previous Owner | Karp Jeffrey D | $247,500 |
Source: Public Records
Tax History
| Year | Tax Paid | Tax Assessment Tax Assessment Total Assessment is a certain percentage of the fair market value that is determined by local assessors to be the total taxable value of land and additions on the property. | Land | Improvement |
|---|---|---|---|---|
| 2025 | $11,823 | $689,400 | $313,800 | $375,600 |
| 2024 | $11,094 | $665,500 | $313,800 | $351,700 |
| 2023 | $10,794 | $614,700 | $285,000 | $329,700 |
| 2022 | $10,231 | $526,000 | $247,800 | $278,200 |
| 2021 | $10,137 | $501,100 | $229,300 | $271,800 |
| 2020 | $9,568 | $497,300 | $229,300 | $268,000 |
| 2019 | $9,112 | $470,400 | $229,300 | $241,100 |
| 2018 | $8,969 | $462,800 | $229,300 | $233,500 |
| 2017 | $8,749 | $459,000 | $229,300 | $229,700 |
| 2016 | $8,736 | $454,300 | $229,300 | $225,000 |
| 2015 | $8,580 | $450,400 | $229,300 | $221,100 |
| 2014 | $8,342 | $428,900 | $229,300 | $199,600 |
Source: Public Records
Map
Nearby Homes
Your Personal Tour Guide
Ask me questions while you tour the home.