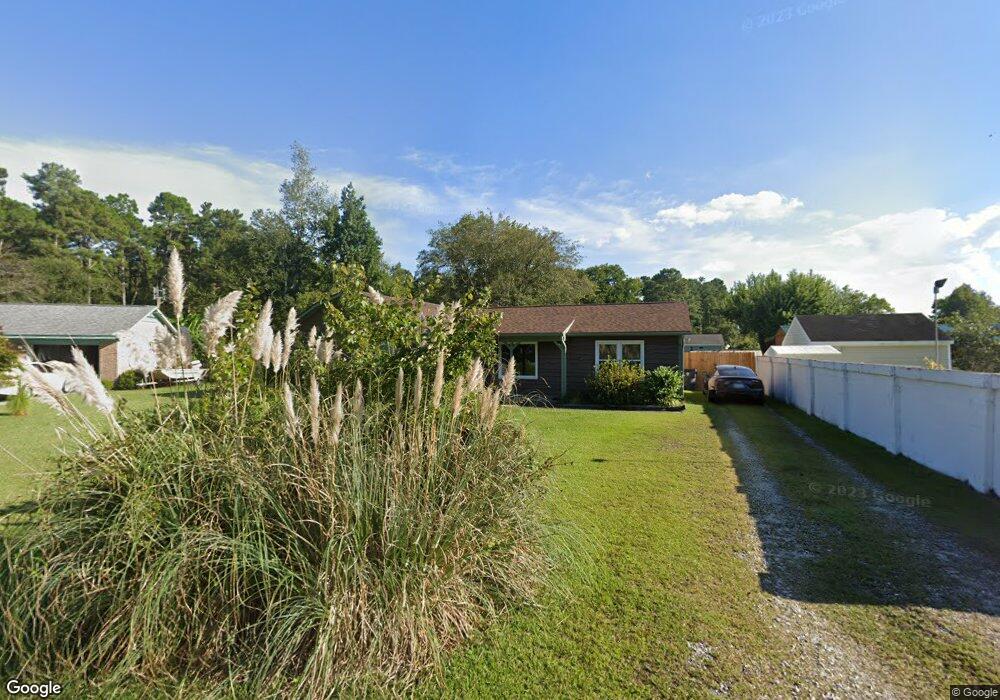
6 Neil Ct Wilmington, NC 28411
Estimated Value: $307,710 - $346,000
3
Beds
2
Baths
1,392
Sq Ft
$233/Sq Ft
Est. Value
About This Home
This home is located at 6 Neil Ct, Wilmington, NC 28411 and is currently estimated at $324,678, approximately $233 per square foot. 6 Neil Ct is a home located in New Hanover County with nearby schools including Murrayville Elementary School, Emma B. Trask Middle School, and Emsley A. Laney High School.
Ownership History
Date
Name
Owned For
Owner Type
Purchase Details
Closed on
Dec 16, 2004
Sold by
Stith Karen D
Bought by
Charles Patrick D
Current Estimated Value
Purchase Details
Closed on
Feb 28, 1997
Sold by
Howard Leroy
Bought by
Stith Karen D
Purchase Details
Closed on
May 24, 1993
Sold by
Howard Gwendolyn
Bought by
Howard Leroy
Purchase Details
Closed on
Aug 27, 1991
Sold by
Keith Melvin E Jr Sarah E
Bought by
Howard Leroy Gwendolyn
Purchase Details
Closed on
Nov 1, 1987
Sold by
Cottle Freddie D Sue R
Bought by
Keith Melvin E Jr Sarah E
Purchase Details
Closed on
Aug 1, 1984
Sold by
Price Marvin J Jr Karen M
Bought by
Cottle Freddie D Sue R
Purchase Details
Closed on
Aug 1, 1982
Sold by
Barthule Jimmie D Bonnie E
Bought by
Price Marvin J Jr Karen M
Purchase Details
Closed on
Aug 1, 1979
Bought by
Barthule Jimmie D Bonnie E
Create a Home Valuation Report for This Property
The Home Valuation Report is an in-depth analysis detailing your home's value as well as a comparison with similar homes in the area
Home Values in the Area
Average Home Value in this Area
Purchase History
| Date | Buyer | Sale Price | Title Company |
|---|---|---|---|
| Charles Patrick D | $114,000 | -- | |
| Stith Karen D | $85,000 | -- | |
| Howard Leroy | -- | -- | |
| Howard Leroy Gwendolyn | $7,500 | -- | |
| Keith Melvin E Jr Sarah E | $57,500 | -- | |
| Cottle Freddie D Sue R | $46,900 | -- | |
| Price Marvin J Jr Karen M | $14,000 | -- | |
| Barthule Jimmie D Bonnie E | -- | -- |
Source: Public Records
Tax History Compared to Growth
Tax History
| Year | Tax Paid | Tax Assessment Tax Assessment Total Assessment is a certain percentage of the fair market value that is determined by local assessors to be the total taxable value of land and additions on the property. | Land | Improvement |
|---|---|---|---|---|
| 2025 | $948 | $289,900 | $115,400 | $174,500 |
| 2023 | $948 | $167,300 | $73,300 | $94,000 |
| 2022 | $950 | $167,300 | $73,300 | $94,000 |
| 2021 | $928 | $167,300 | $73,300 | $94,000 |
| 2020 | $877 | $138,600 | $44,100 | $94,500 |
| 2019 | $877 | $138,600 | $44,100 | $94,500 |
| 2018 | $877 | $138,600 | $44,100 | $94,500 |
| 2017 | $897 | $138,600 | $44,100 | $94,500 |
| 2016 | $827 | $119,400 | $44,100 | $75,300 |
| 2015 | $769 | $119,400 | $44,100 | $75,300 |
| 2014 | $756 | $119,400 | $44,100 | $75,300 |
Source: Public Records
Map
Nearby Homes
- Lot 184 Murrayville Rd
- 1311 Stonehaven Ct
- 6609 Murrayville Rd
- 6707 Creek Ridge Rd
- 3615 Leaning Tree Ct
- 6404 Shire Ln
- 6517 Yellow Bell Rd
- 1016 Jackson's Ridge Ct
- 168 Greenview Ranch
- 1409 Weimaraner Ct
- 1518 Whispering Woods Ct
- 7542 Quail Woods Rd
- 706 Bent Twig Ct
- 7024 Forest Bend Ln
- 226 Plantation W
- 1303 Big Horn Ct
- 802 Calico Crossing
- 7141 Cameron Trace Dr
- 800 Caspian Ct
- 6918 Haberdeen Dr
- 10 Neil Ct
- 210 Rockwell Rd
- 206 Rockwell Rd
- 206 Rockwell Rd Unit 3735
- 809 5 Acres Rd
- 805 5 Acres Rd
- 14 Neil Ct
- 813 5 Acres Rd
- 214 Rockwell Rd
- 801 Five Acres Rd
- 5 Neil Ct
- 9 Neil Ct
- 218 Rockwell Rd
- 209 Rockwell Rd
- 213 Rockwell Rd
- 126 Rockwell Rd
- 205 Rockwell Rd
- 217 Rockwell Rd
- 201 Rockwell Rd
- 221 Rockwell Rd