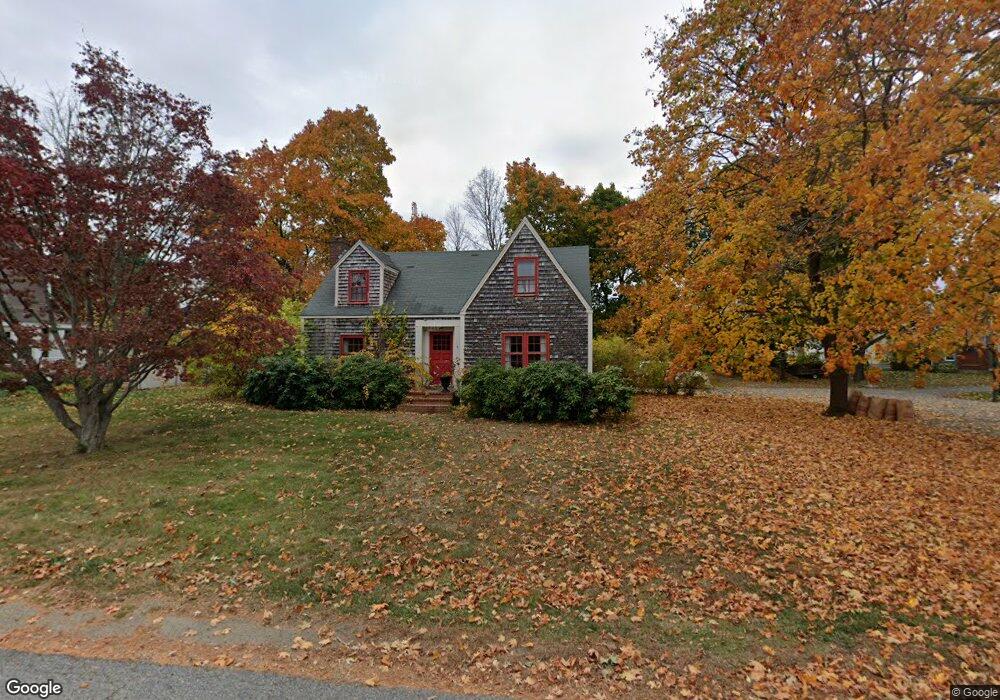
6 New St Newburyport, MA 01950
Estimated Value: $717,000 - $973,000
3
Beds
2
Baths
1,568
Sq Ft
$529/Sq Ft
Est. Value
About This Home
This home is located at 6 New St, Newburyport, MA 01950 and is currently estimated at $829,843, approximately $529 per square foot. 6 New St is a home located in Essex County with nearby schools including Francis T. Bresnahan Elementary School, Edward G. Molin Elementary School, and Rupert A. Nock Middle School.
Ownership History
Date
Name
Owned For
Owner Type
Purchase Details
Closed on
Jan 6, 2019
Sold by
Farley James E
Bought by
Farley Ft and Farley
Current Estimated Value
Purchase Details
Closed on
Jun 23, 1972
Bought by
Farley James E
Create a Home Valuation Report for This Property
The Home Valuation Report is an in-depth analysis detailing your home's value as well as a comparison with similar homes in the area
Home Values in the Area
Average Home Value in this Area
Purchase History
| Date | Buyer | Sale Price | Title Company |
|---|---|---|---|
| Farley Ft | -- | -- | |
| Farley Ft | -- | -- | |
| Farley James E | -- | -- |
Source: Public Records
Mortgage History
| Date | Status | Borrower | Loan Amount |
|---|---|---|---|
| Previous Owner | Farley James E | $35,000 | |
| Previous Owner | Farley James E | $40,000 | |
| Previous Owner | Farley James E | $41,000 | |
| Previous Owner | Farley James E | $25,000 |
Source: Public Records
Tax History Compared to Growth
Tax History
| Year | Tax Paid | Tax Assessment Tax Assessment Total Assessment is a certain percentage of the fair market value that is determined by local assessors to be the total taxable value of land and additions on the property. | Land | Improvement |
|---|---|---|---|---|
| 2025 | $7,168 | $748,200 | $459,800 | $288,400 |
| 2024 | $6,796 | $681,600 | $418,000 | $263,600 |
| 2023 | $6,455 | $601,000 | $363,400 | $237,600 |
| 2022 | $5,945 | $495,000 | $302,900 | $192,100 |
| 2021 | $5,832 | $461,400 | $275,400 | $186,000 |
| 2020 | $5,775 | $449,800 | $275,400 | $174,400 |
| 2019 | $5,713 | $436,800 | $275,400 | $161,400 |
| 2018 | $5,589 | $421,500 | $262,300 | $159,200 |
| 2017 | $5,411 | $402,300 | $249,800 | $152,500 |
| 2016 | $5,090 | $380,100 | $227,600 | $152,500 |
| 2015 | $4,876 | $365,500 | $227,600 | $137,900 |
Source: Public Records
Map
Nearby Homes
- 20 Cushing Ave
- 510 Merrimac St Unit 512
- 492 Merrimac St
- 30 Dorothy e Lucey Dr
- 572 Merrimac St
- 6 Boyd Dr
- 19 Jefferson St
- 42 Myrtle Ave
- 17 Alberta Ave
- 8 Brown Ave
- 6 Woodman Way Unit 402
- 6 Woodman Way Unit 122
- 10 Clipper Way
- 9 N Atkinson St
- 61 Clipper Way
- 29 Columbus Ave
- 18 Hawkswood Estates
- 346 Merrimac St
- 10 Rawson Hill Rd
- 486 Main St