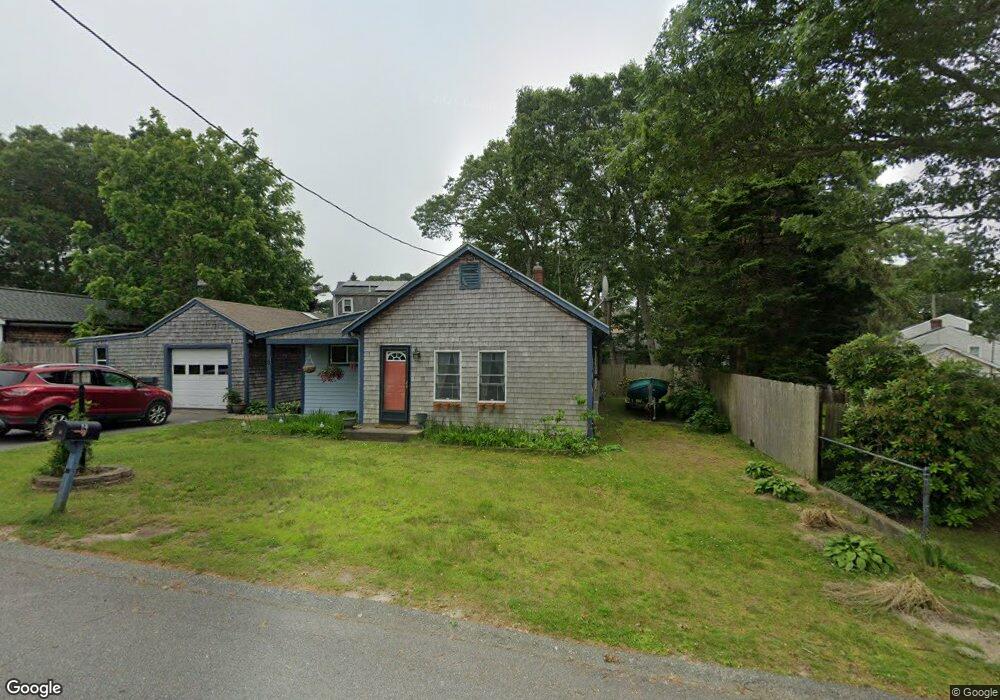
6 Nick Vedder Rd Bourne, MA 2532
Buzzards Bay NeighborhoodEstimated Value: $463,000 - $542,000
About This Home
This home is located at 6 Nick Vedder Rd, Bourne, MA 2532 and is currently estimated at $512,845, approximately $430 per square foot. 6 Nick Vedder Rd is a home located in Barnstable County with nearby schools including Bourne High School and St Margaret Regional School.
Ownership History
We collect this data history from publicly available records. To have your information removed, we recommend requesting removal directly through your county’s website.
Purchase Details
Home Financials for this Owner
Home Financials are based on the most recent Mortgage that was taken out on this home.Purchase Details
Purchase Details
Purchase Details
Home Values in the Area
Average Home Value in this Area
Purchase History
We collect this data history from publicly available records. To have your information removed, we recommend requesting removal directly through your county’s website.
| Date | Buyer | Sale Price | Title Company |
|---|---|---|---|
| $221,500 | -- | ||
| $221,500 | -- | ||
| $221,500 | -- | ||
| $219,000 | -- | ||
| $219,000 | -- | ||
| $219,000 | -- | ||
| $140,000 | -- | ||
| $140,000 | -- | ||
| $73,500 | -- | ||
| $73,500 | -- | ||
| $73,500 | -- | ||
| $73,500 | -- |
Mortgage History
We collect this data history from publicly available records. To have your information removed, we recommend requesting removal directly through your county’s website.
| Date | Status | Borrower | Loan Amount |
|---|---|---|---|
| Open | $199,300 | ||
| Closed | $199,300 |
Tax History
We collect this data history from publicly available records. To have your information removed, we recommend requesting removal directly through your county’s website.
| Year | Tax Paid | Tax Assessment Tax Assessment Total Assessment is a certain percentage of the fair market value that is determined by local assessors to be the total taxable value of land and additions on the property. | Land | Improvement |
|---|---|---|---|---|
| 2025 | $3,325 | $425,800 | $170,500 | $255,300 |
| 2024 | $3,252 | $405,500 | $162,400 | $243,100 |
| 2023 | $3,193 | $362,400 | $143,700 | $218,700 |
| 2022 | $3,053 | $302,600 | $127,200 | $175,400 |
| 2021 | $2,979 | $276,600 | $115,800 | $160,800 |
| 2020 | $4,776 | $263,700 | $114,700 | $149,000 |
| 2019 | $2,692 | $256,100 | $114,700 | $141,400 |
| 2018 | $4,161 | $232,900 | $103,800 | $129,100 |
| 2017 | $2,376 | $230,700 | $102,800 | $127,900 |
| 2016 | $2,179 | $214,500 | $92,000 | $122,500 |
| 2015 | $1,911 | $189,800 | $92,000 | $97,800 |
Map
- 4 Van Bummel Rd
- 34 Washington Ave
- 19 Lafayette Ave
- 26 Wilson Ave
- 56 Rip Van Winkle Way
- 13 Harrison Ave
- 151 - 153 Main St
- 10 Harrison Ave Unit 2
- 10 Harrison Ave Unit 3
- 10 Harrison Ave Unit 4
- 10 Harrison Ave Unit 1
- 0 Holt Rd
- 46 Holt Rd Unit A
- 9 Blueberry Rd
- 5 Bell Rd
- 8 Pine Tree Dr
- 65 Lewis Point Rd
- 17 Bungalow Ln
- 49 Onset Ave
- 57 Onset Ave
- 5 Puritan Rd
- 5 Puritan Rd
- 46 Lincoln Ave
- 7 Puritan Rd
- 38 Lincoln Ave
- 8 Puritan Rd
- 46 Lincoln Ave
- 46 Lincoln Ave
- 8 Puritan Rd
- 6 Nick Vedder Rd
- 4 Nick Vedder Rd
- 43 Lincoln Ave
- 43 Lincoln Ave Unit A
- 43A Lincoln Ave Unit A
- 43A Lincoln Ave
- 43 Lincoln Ave
- 4 Nick Vedder Rd
- 4 Puritan Rd
- 4 Puritan Rd
- 39 Washington Ave
Ask me questions while you tour the home.