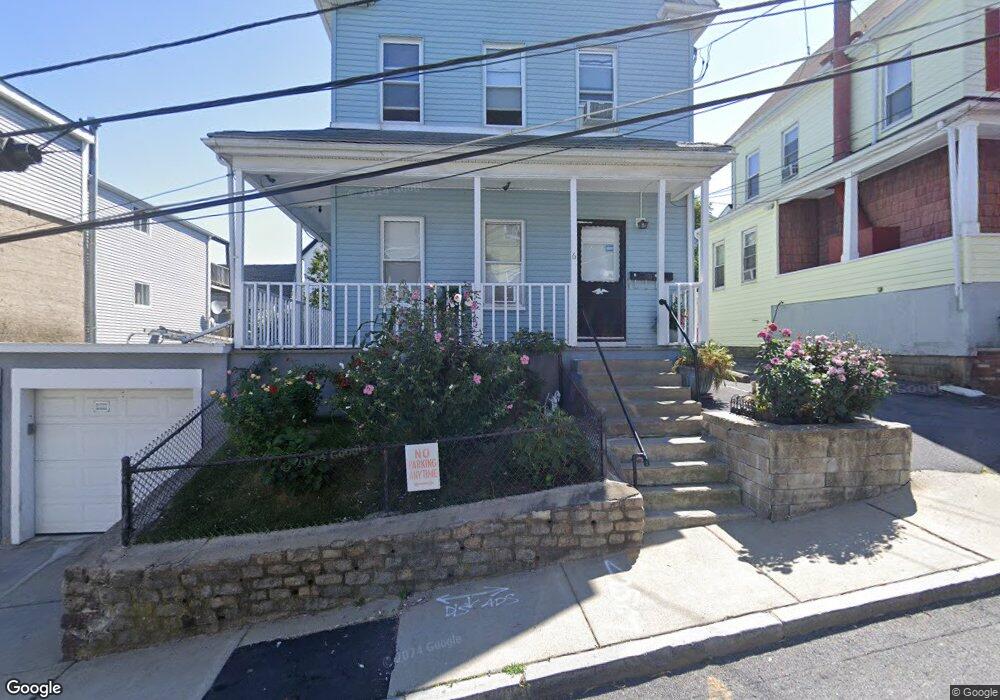
6 Nielson Ave Everett, MA 02149
Glendale NeighborhoodEstimated Value: $743,407 - $873,000
4
Beds
3
Baths
1,895
Sq Ft
$425/Sq Ft
Est. Value
About This Home
This home is located at 6 Nielson Ave, Everett, MA 02149 and is currently estimated at $804,852, approximately $424 per square foot. 6 Nielson Ave is a home located in Middlesex County with nearby schools including Everett High School and Pioneer Charter School of Science.
Ownership History
Date
Name
Owned For
Owner Type
Purchase Details
Closed on
Dec 1, 2004
Sold by
Ferro Joseph P and Ferro Marilyn
Bought by
Torres Louis and Torres Yonis
Current Estimated Value
Home Financials for this Owner
Home Financials are based on the most recent Mortgage that was taken out on this home.
Original Mortgage
$340,000
Outstanding Balance
$169,819
Interest Rate
5.69%
Mortgage Type
Purchase Money Mortgage
Estimated Equity
$635,033
Create a Home Valuation Report for This Property
The Home Valuation Report is an in-depth analysis detailing your home's value as well as a comparison with similar homes in the area
Home Values in the Area
Average Home Value in this Area
Purchase History
| Date | Buyer | Sale Price | Title Company |
|---|---|---|---|
| Torres Louis | $340,000 | -- |
Source: Public Records
Mortgage History
| Date | Status | Borrower | Loan Amount |
|---|---|---|---|
| Open | Torres Louis | $340,000 |
Source: Public Records
Tax History
| Year | Tax Paid | Tax Assessment Tax Assessment Total Assessment is a certain percentage of the fair market value that is determined by local assessors to be the total taxable value of land and additions on the property. | Land | Improvement |
|---|---|---|---|---|
| 2025 | $7,744 | $679,900 | $259,200 | $420,700 |
| 2024 | $7,093 | $618,900 | $230,400 | $388,500 |
| 2023 | $6,829 | $579,700 | $211,200 | $368,500 |
| 2022 | $5,637 | $544,100 | $201,600 | $342,500 |
| 2021 | $5,041 | $510,700 | $180,500 | $330,200 |
| 2020 | $5,320 | $500,000 | $180,500 | $319,500 |
| 2019 | $5,639 | $455,500 | $171,800 | $283,700 |
| 2018 | $5,551 | $402,800 | $149,800 | $253,000 |
| 2017 | $4,947 | $342,600 | $115,200 | $227,400 |
| 2016 | $4,582 | $317,100 | $115,200 | $201,900 |
| 2015 | $4,357 | $298,200 | $108,200 | $190,000 |
Source: Public Records
Map
Nearby Homes
- 53 Sycamore St
- 20 Fairmount St
- 44 Walnut St
- 17 Jones St Unit 2
- 15 Staples Ave Unit 45
- 15 Staples Ave Unit 31
- 21 Staples Ave Unit 26
- 859 Broadway Unit 15
- 21 Central Ave Unit 10
- 110 Ferry St
- 13 Coolidge St
- 881 Broadway Unit 44
- 55 Garland St
- 37 Argyle St
- 528 Ferry St
- 51 Adams Ave
- 211 Elm St
- 48 Cleveland Ave
- 19 Mills St
- 99 Florence St
- 8 Nielson Ave
- 4 Nielson Ave Unit 3
- 4 Nielson Ave Unit 2
- 4 Nielson Ave Unit 1
- 9 Hillside Ave
- 15 Hillside Ave
- 7 Illside Unit 2
- 7 Nielson Ave Unit 1
- 7 Nielson Ave Unit 2
- 7 Nielson Ave
- 7 Nielson Ave Unit 3
- 7 Hillside Ave Unit 2A
- 7 Hillside Ave
- 7 Hillside Ave
- 7 Hillside Ave Unit 2
- 7 Hillside Ave Unit 1
- 30 Oakland Ave
- 5 Nielson Ave
- 308 Ferry St
- 21 Hillside Ave
Your Personal Tour Guide
Ask me questions while you tour the home.