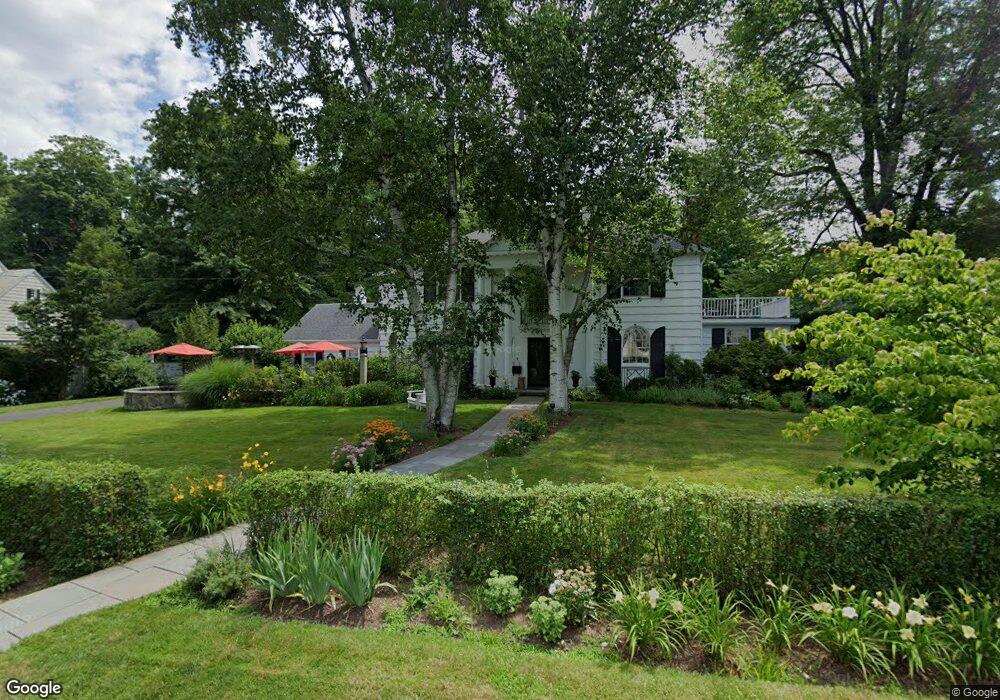
6 Northmoor Rd West Hartford, CT 06117
Estimated Value: $907,000 - $960,344
4
Beds
3
Baths
3,151
Sq Ft
$296/Sq Ft
Est. Value
About This Home
This home is located at 6 Northmoor Rd, West Hartford, CT 06117 and is currently estimated at $931,336, approximately $295 per square foot. 6 Northmoor Rd is a home located in Hartford County with nearby schools including Aiken School, King Philip Middle School, and Hall High School.
Ownership History
Date
Name
Owned For
Owner Type
Purchase Details
Closed on
Feb 21, 2024
Sold by
Rybka Henryk S and Rybka Henry K
Bought by
Rybka Henryk S and Rybka Ann K
Current Estimated Value
Purchase Details
Closed on
Jun 11, 2018
Sold by
Rybka Henryk S
Bought by
Rybka Ann K and Rybka Henryk S
Purchase Details
Closed on
Feb 1, 1999
Sold by
Donzello Suzanne
Bought by
Rybka Stanley Henryk and Keating-Rybka Ann
Home Financials for this Owner
Home Financials are based on the most recent Mortgage that was taken out on this home.
Original Mortgage
$219,000
Interest Rate
6.67%
Mortgage Type
Purchase Money Mortgage
Purchase Details
Closed on
May 7, 1993
Sold by
Gordon Fern
Bought by
Donzello Lois
Create a Home Valuation Report for This Property
The Home Valuation Report is an in-depth analysis detailing your home's value as well as a comparison with similar homes in the area
Home Values in the Area
Average Home Value in this Area
Purchase History
| Date | Buyer | Sale Price | Title Company |
|---|---|---|---|
| Rybka Henryk S | -- | None Available | |
| Rybka Henryk S | -- | None Available | |
| Rybka Ann K | -- | -- | |
| Rybka Ann K | -- | -- | |
| Rybka Stanley Henryk | $273,750 | -- | |
| Rybka Stanley Henryk | $273,750 | -- | |
| Donzello Lois | $225,000 | -- | |
| Donzello Lois | $225,000 | -- |
Source: Public Records
Mortgage History
| Date | Status | Borrower | Loan Amount |
|---|---|---|---|
| Previous Owner | Donzello Lois | $170,450 | |
| Previous Owner | Donzello Lois | $219,000 |
Source: Public Records
Tax History Compared to Growth
Tax History
| Year | Tax Paid | Tax Assessment Tax Assessment Total Assessment is a certain percentage of the fair market value that is determined by local assessors to be the total taxable value of land and additions on the property. | Land | Improvement |
|---|---|---|---|---|
| 2025 | $17,969 | $401,270 | $160,400 | $240,870 |
| 2024 | $16,994 | $401,270 | $160,400 | $240,870 |
| 2023 | $16,420 | $401,270 | $160,400 | $240,870 |
| 2022 | $16,324 | $401,270 | $160,400 | $240,870 |
| 2021 | $14,373 | $338,830 | $128,900 | $209,930 |
| 2020 | $14,109 | $337,540 | $134,700 | $202,840 |
| 2019 | $14,109 | $337,540 | $134,680 | $202,860 |
| 2018 | $13,839 | $337,540 | $134,680 | $202,860 |
| 2017 | $13,853 | $337,540 | $134,680 | $202,860 |
| 2016 | $14,761 | $373,590 | $158,550 | $215,040 |
| 2015 | $14,312 | $373,590 | $158,550 | $215,040 |
| 2014 | $13,961 | $373,590 | $158,550 | $215,040 |
Source: Public Records
Map
Nearby Homes
- 5 Northmoor Rd
- 111 Bloomfield Ave
- 320 N Steele Rd
- 243 Terry Rd
- 165 Bloomfield Ave
- 175 Scarborough St
- 80 Terry Rd
- 3 Trumbull Ln
- 25 Cornwall St
- 7 Sequin Rd
- 103 Baltimore St
- 111 Westbourne Pkwy Unit 113
- 11 Lawler Rd
- 275 Kenyon St
- 60 Goodwin Cir
- 144 Thomaston St
- 157 Pembroke St Unit 159
- 150 Adams St Unit 152
- 109 Blue Hills Ave
- 293 Oxford St
- 1856 Albany Ave
- 10 Northmoor Rd
- 1886 Albany Ave
- 11 Northmoor Rd
- 1844 Albany Ave
- 20 Northmoor Rd
- 77 Bloomfield Ave
- 1820 Albany Ave
- 10 Amanda Ln
- 6 Chesterfield Ln
- 15 Amanda Ln
- 106 Bainton Rd
- 26 Northmoor Rd
- 1906 Albany Ave
- 79 Bloomfield Ave
- 1818 Albany Ave
- 79A Bloomfield Ave
- 4 Amanda Ln
- 81 Bloomfield Ave
- 4 Adams Ln