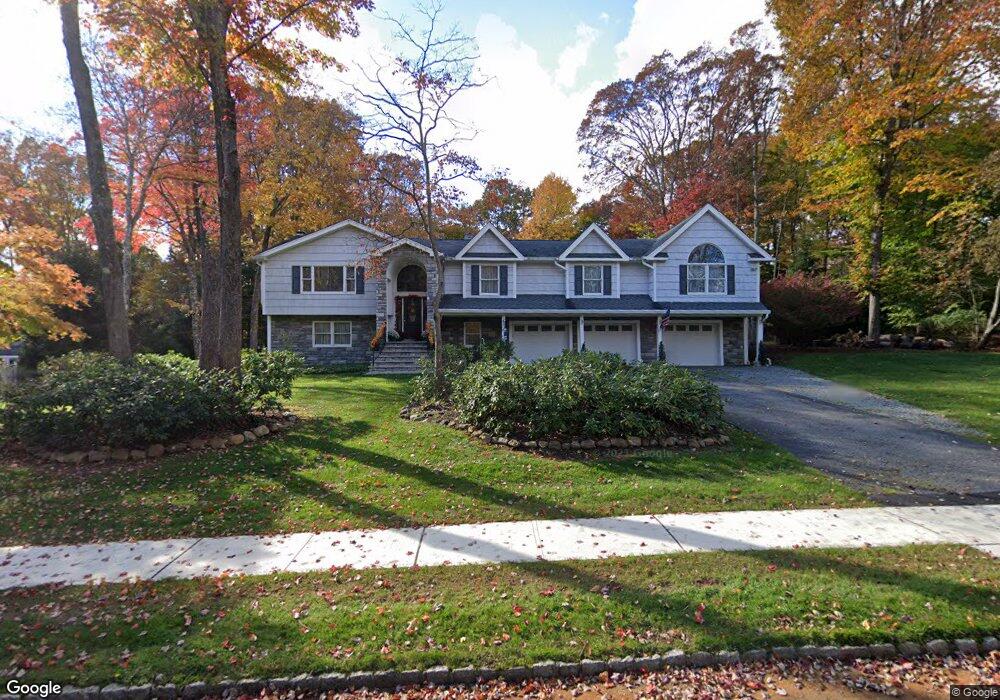
6 Nyma Way Succasunna, NJ 07876
Estimated Value: $750,000 - $934,000
--
Bed
--
Bath
3,628
Sq Ft
$236/Sq Ft
Est. Value
About This Home
This home is located at 6 Nyma Way, Succasunna, NJ 07876 and is currently estimated at $856,147, approximately $235 per square foot. 6 Nyma Way is a home located in Morris County with nearby schools including Lincoln Roosevelt Elementary School, Eisenhower Middle School, and Roxbury High School.
Ownership History
Date
Name
Owned For
Owner Type
Purchase Details
Closed on
Apr 18, 2001
Sold by
Haas Kurt
Bought by
Caruk Michael
Current Estimated Value
Home Financials for this Owner
Home Financials are based on the most recent Mortgage that was taken out on this home.
Original Mortgage
$200,000
Outstanding Balance
$72,959
Interest Rate
6.88%
Estimated Equity
$783,188
Purchase Details
Closed on
Aug 4, 1997
Sold by
Wingard Theodore K and Marolyn Wingard B
Bought by
Haas Kurt and Haas Gretchen
Home Financials for this Owner
Home Financials are based on the most recent Mortgage that was taken out on this home.
Original Mortgage
$123,000
Interest Rate
3.95%
Create a Home Valuation Report for This Property
The Home Valuation Report is an in-depth analysis detailing your home's value as well as a comparison with similar homes in the area
Home Values in the Area
Average Home Value in this Area
Purchase History
| Date | Buyer | Sale Price | Title Company |
|---|---|---|---|
| Caruk Michael | $280,000 | -- | |
| Haas Kurt | $248,000 | -- |
Source: Public Records
Mortgage History
| Date | Status | Borrower | Loan Amount |
|---|---|---|---|
| Open | Caruk Michael | $200,000 | |
| Previous Owner | Haas Kurt | $123,000 |
Source: Public Records
Tax History Compared to Growth
Tax History
| Year | Tax Paid | Tax Assessment Tax Assessment Total Assessment is a certain percentage of the fair market value that is determined by local assessors to be the total taxable value of land and additions on the property. | Land | Improvement |
|---|---|---|---|---|
| 2025 | $15,037 | $547,000 | $162,500 | $384,500 |
| 2024 | $14,802 | $547,000 | $162,500 | $384,500 |
| 2023 | $14,802 | $547,000 | $162,500 | $384,500 |
| 2022 | $14,408 | $547,000 | $162,500 | $384,500 |
| 2021 | $14,408 | $547,000 | $162,500 | $384,500 |
| 2020 | $14,381 | $547,000 | $162,500 | $384,500 |
| 2019 | $14,113 | $547,000 | $162,500 | $384,500 |
| 2018 | $14,081 | $326,700 | $93,800 | $232,900 |
| 2017 | $14,006 | $326,700 | $93,800 | $232,900 |
| 2016 | $13,731 | $326,700 | $93,800 | $232,900 |
| 2015 | $13,391 | $326,700 | $93,800 | $232,900 |
| 2014 | $13,179 | $326,700 | $93,800 | $232,900 |
Source: Public Records
Map
Nearby Homes