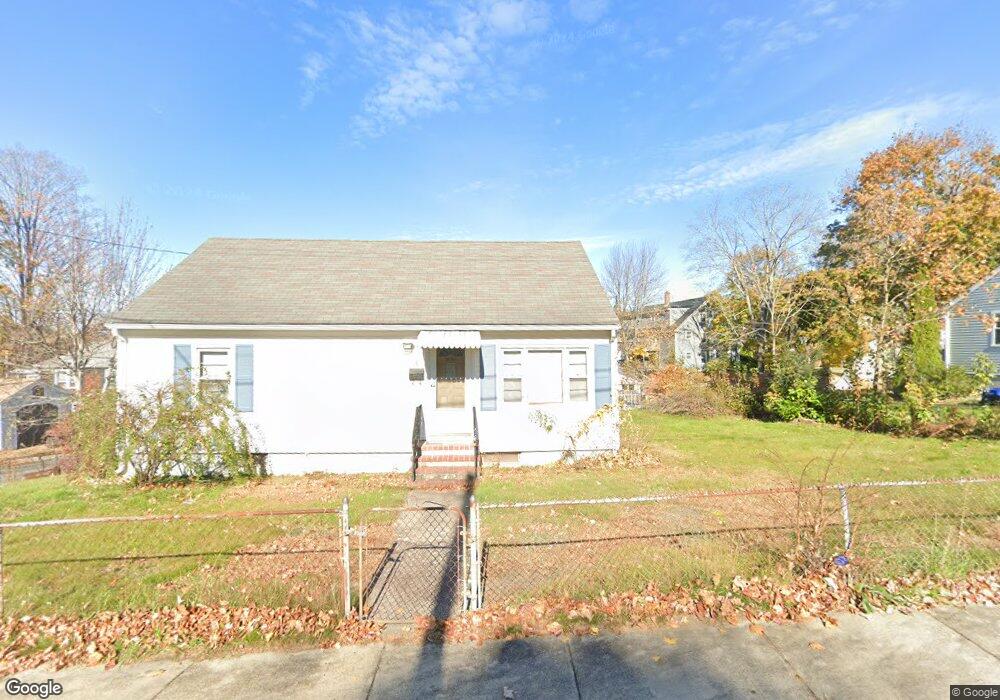
6 Oak St Amesbury, MA 01913
Estimated Value: $453,000 - $522,000
2
Beds
1
Bath
850
Sq Ft
$571/Sq Ft
Est. Value
About This Home
This home is located at 6 Oak St, Amesbury, MA 01913 and is currently estimated at $485,582, approximately $571 per square foot. 6 Oak St is a home located in Essex County with nearby schools including Amesbury High School and Amesbury Seventh-Day Adventist School.
Ownership History
Date
Name
Owned For
Owner Type
Purchase Details
Closed on
Jun 16, 2003
Sold by
Magdalenski Patricia A and Quinn Patricia J
Bought by
Magdalenski David
Current Estimated Value
Purchase Details
Closed on
Mar 16, 1994
Sold by
Belanger Joseph
Bought by
Belanger Richard R and Belanger Judith A
Home Financials for this Owner
Home Financials are based on the most recent Mortgage that was taken out on this home.
Original Mortgage
$64,000
Interest Rate
6.9%
Mortgage Type
Purchase Money Mortgage
Create a Home Valuation Report for This Property
The Home Valuation Report is an in-depth analysis detailing your home's value as well as a comparison with similar homes in the area
Home Values in the Area
Average Home Value in this Area
Purchase History
| Date | Buyer | Sale Price | Title Company |
|---|---|---|---|
| Magdalenski David | -- | -- | |
| Belanger Richard R | $80,000 | -- |
Source: Public Records
Mortgage History
| Date | Status | Borrower | Loan Amount |
|---|---|---|---|
| Previous Owner | Belanger Richard R | $64,000 |
Source: Public Records
Tax History
| Year | Tax Paid | Tax Assessment Tax Assessment Total Assessment is a certain percentage of the fair market value that is determined by local assessors to be the total taxable value of land and additions on the property. | Land | Improvement |
|---|---|---|---|---|
| 2025 | $6,112 | $399,500 | $202,500 | $197,000 |
| 2024 | $5,774 | $369,200 | $191,000 | $178,200 |
| 2023 | $5,626 | $344,300 | $166,100 | $178,200 |
| 2022 | $5,433 | $307,100 | $144,400 | $162,700 |
| 2021 | $4,847 | $265,600 | $111,500 | $154,100 |
| 2020 | $4,329 | $252,000 | $107,300 | $144,700 |
| 2019 | $4,295 | $233,800 | $107,300 | $126,500 |
| 2018 | $4,400 | $231,700 | $102,200 | $129,500 |
| 2017 | $4,138 | $207,400 | $102,200 | $105,200 |
| 2016 | $4,054 | $199,900 | $102,200 | $97,700 |
| 2015 | $3,938 | $191,700 | $102,200 | $89,500 |
| 2014 | $3,609 | $172,100 | $102,200 | $69,900 |
Source: Public Records
Map
Nearby Homes
- 24 Collins St
- 10 Congress St Unit 302
- 21 River St
- 35 Huntington Ave
- 21 Congress St
- 97 Elm St
- 4 Boardman St
- 25 Cedar St Unit 4
- 4 Greenwood St
- 20 Lincoln Ct
- 4 Larnard Ct
- 101 Market St Unit B
- 8 Winter St
- 15 Wells Ave
- 253 Main St
- 382 Main St
- 27 Lake St
- 5 Russell St Unit 1
- 1 Hillside Ave Unit 3
- 3 Tremont Ave Unit A
Your Personal Tour Guide
Ask me questions while you tour the home.