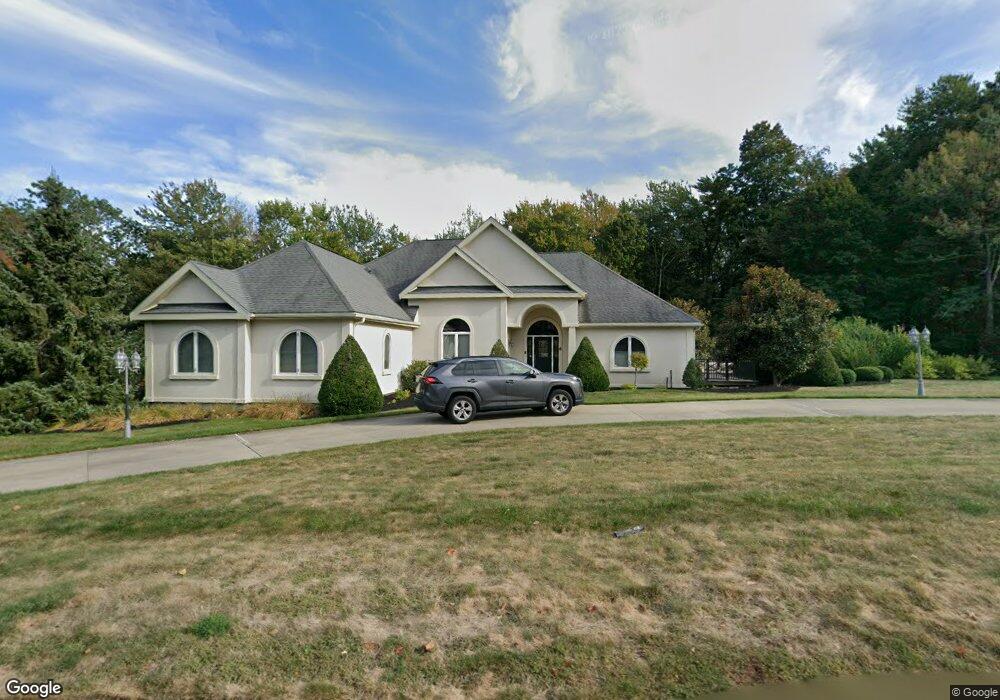
6 Olde Tavern Rd Leominster, MA 01453
Estimated Value: $702,317 - $1,048,000
3
Beds
3
Baths
2,605
Sq Ft
$305/Sq Ft
Est. Value
About This Home
This home is located at 6 Olde Tavern Rd, Leominster, MA 01453 and is currently estimated at $795,329, approximately $305 per square foot. 6 Olde Tavern Rd is a home located in Worcester County with nearby schools including Leominster High School, St. Leo School, and St. Anna Catholic School.
Ownership History
Date
Name
Owned For
Owner Type
Purchase Details
Closed on
Jul 31, 2002
Sold by
Apple Tree Rt and Hachey Alexis
Bought by
Rigopoulos Peter G and Rigopoulos Eleftheria
Current Estimated Value
Home Financials for this Owner
Home Financials are based on the most recent Mortgage that was taken out on this home.
Original Mortgage
$353,500
Interest Rate
6.64%
Mortgage Type
Purchase Money Mortgage
Purchase Details
Closed on
Jul 26, 2001
Sold by
Nc Rt and Cohen Bertram M
Bought by
Appletree Rt and Hachey Alexis
Create a Home Valuation Report for This Property
The Home Valuation Report is an in-depth analysis detailing your home's value as well as a comparison with similar homes in the area
Home Values in the Area
Average Home Value in this Area
Purchase History
| Date | Buyer | Sale Price | Title Company |
|---|---|---|---|
| Rigopoulos Peter G | $505,000 | -- | |
| Appletree Rt | $110,000 | -- |
Source: Public Records
Mortgage History
| Date | Status | Borrower | Loan Amount |
|---|---|---|---|
| Open | Appletree Rt | $304,500 | |
| Closed | Appletree Rt | $72,300 | |
| Closed | Appletree Rt | $310,000 | |
| Closed | Appletree Rt | $353,500 |
Source: Public Records
Tax History Compared to Growth
Tax History
| Year | Tax Paid | Tax Assessment Tax Assessment Total Assessment is a certain percentage of the fair market value that is determined by local assessors to be the total taxable value of land and additions on the property. | Land | Improvement |
|---|---|---|---|---|
| 2025 | $8,547 | $609,200 | $207,100 | $402,100 |
| 2024 | $8,124 | $559,900 | $197,000 | $362,900 |
| 2023 | $7,938 | $510,800 | $171,500 | $339,300 |
| 2022 | $7,613 | $459,700 | $149,100 | $310,600 |
| 2021 | $8,037 | $443,300 | $116,200 | $327,100 |
| 2020 | $7,832 | $435,600 | $116,200 | $319,400 |
| 2019 | $7,844 | $423,100 | $118,100 | $305,000 |
| 2018 | $7,618 | $394,100 | $107,900 | $286,200 |
| 2017 | $8,010 | $406,000 | $100,700 | $305,300 |
| 2016 | $8,147 | $416,100 | $100,700 | $315,400 |
| 2015 | $7,828 | $402,700 | $100,700 | $302,000 |
| 2014 | $7,399 | $391,700 | $106,100 | $285,600 |
Source: Public Records
Map
Nearby Homes