6 Oliver St Easthampton, MA 01027
Estimated Value: $424,000 - $451,000
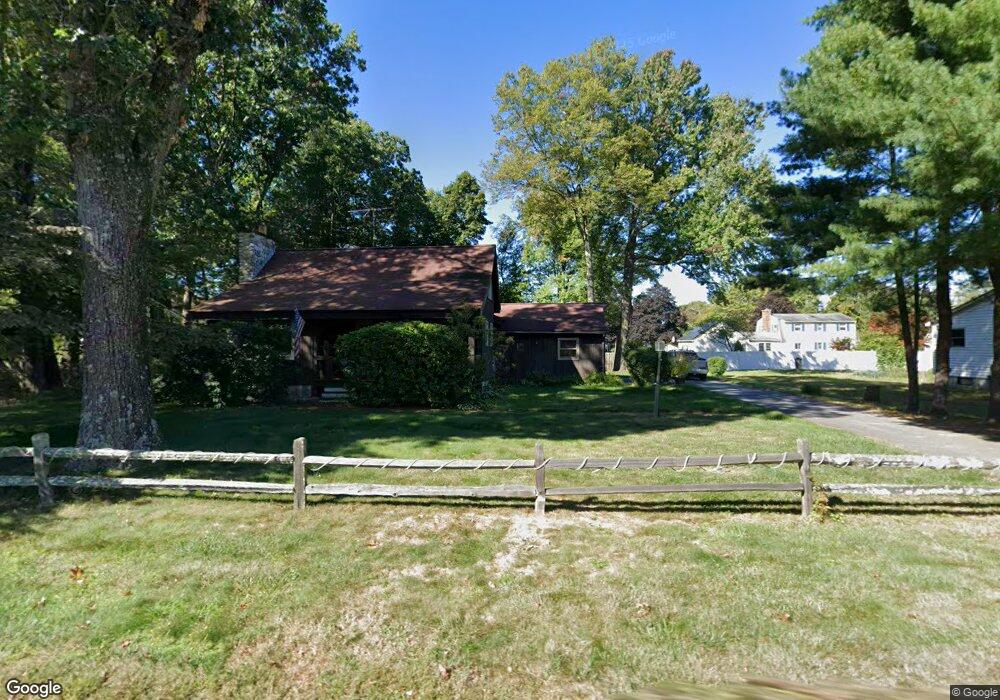
About This Home
This home is located at 6 Oliver St, Easthampton, MA 01027 and is currently estimated at $435,828, approximately $267 per square foot. 6 Oliver St is a home located in Hampshire County with nearby schools including Easthampton High School, Hilltown Cooperative Charter Public School, and Calvary Baptist Christian School.
Ownership History
We collect this data history from publicly available records. To have your information removed, we recommend requesting removal directly through your county’s website.
Purchase Details
Purchase Details
Home Values in the Area
Average Home Value in this Area
Purchase History
We collect this data history from publicly available records. To have your information removed, we recommend requesting removal directly through your county’s website.
| Date | Buyer | Sale Price | Title Company |
|---|---|---|---|
| -- | None Available | ||
| $91,000 | -- |
Mortgage History
We collect this data history from publicly available records. To have your information removed, we recommend requesting removal directly through your county’s website.
| Date | Status | Borrower | Loan Amount |
|---|---|---|---|
| Previous Owner | $33,000 | ||
| Previous Owner | $50,000 | ||
| Previous Owner | $10,000 | ||
| Previous Owner | $30,000 |
Tax History
We collect this data history from publicly available records. To have your information removed, we recommend requesting removal directly through your county’s website.
| Year | Tax Paid | Tax Assessment Tax Assessment Total Assessment is a certain percentage of the fair market value that is determined by local assessors to be the total taxable value of land and additions on the property. | Land | Improvement |
|---|---|---|---|---|
| 2025 | $5,360 | $392,100 | $120,900 | $271,200 |
| 2024 | $5,177 | $381,800 | $117,500 | $264,300 |
| 2023 | $3,882 | $265,000 | $92,500 | $172,500 |
| 2022 | $4,380 | $265,000 | $92,500 | $172,500 |
| 2021 | $4,831 | $275,400 | $92,500 | $182,900 |
| 2020 | $4,706 | $265,000 | $92,500 | $172,500 |
| 2019 | $3,936 | $254,600 | $92,500 | $162,100 |
| 2018 | $3,795 | $237,200 | $87,200 | $150,000 |
| 2017 | $3,706 | $228,600 | $83,800 | $144,800 |
| 2016 | $3,893 | $249,700 | $83,800 | $165,900 |
| 2015 | $3,783 | $249,700 | $83,800 | $165,900 |
Map
- 138 West St
- 10 Robin Rd
- 20 Meadowbrook Dr
- 13 Carillon Cir
- M143 &152 Glendale St
- 16 Steplar Crossing Unit 16
- 359 Main St Unit 1B
- 359 Main St Unit 18A
- 12 Greenwood Ct
- 55 South St
- 64-66 Pleasant St
- 28 Winter St Unit 28
- 85 Garfield Ave
- 422 Park Hill Rd
- 17 Adams St
- 5 Torrey St
- 25 Ballard St
- 36 Torrey St
- 757 Park Hill Rd
- 14 Holyoke St
Ask me questions while you tour the home.