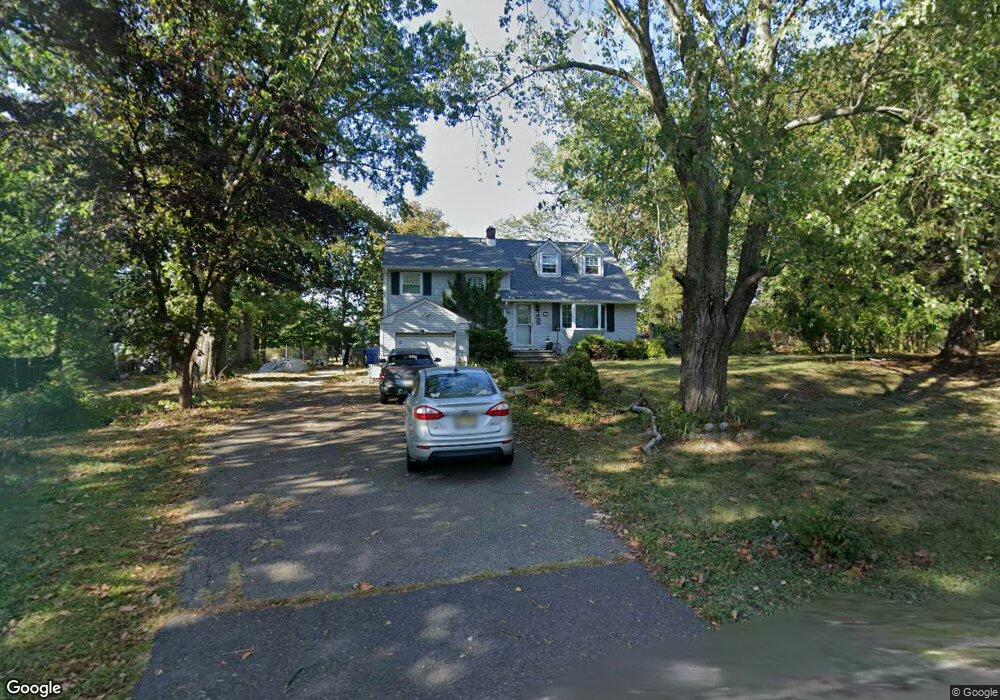
6 Overbrook Rd Piscataway, NJ 08854
Estimated Value: $594,013 - $650,000
Studio
--
Bath
2,100
Sq Ft
$299/Sq Ft
Est. Value
About This Home
This home is located at 6 Overbrook Rd, Piscataway, NJ 08854 and is currently estimated at $627,753, approximately $298 per square foot. 6 Overbrook Rd is a home located in Middlesex County with nearby schools including Martin Luther King Intermediate School, Knollwood Elementary School, and Conackamack Middle School.
Ownership History
Date
Name
Owned For
Owner Type
Purchase Details
Closed on
Dec 22, 1997
Sold by
O'Brien Linda
Bought by
Demes William and Demes Dorothy
Current Estimated Value
Home Financials for this Owner
Home Financials are based on the most recent Mortgage that was taken out on this home.
Original Mortgage
$195,000
Outstanding Balance
$32,583
Interest Rate
7.09%
Mortgage Type
VA
Estimated Equity
$595,170
Create a Home Valuation Report for This Property
The Home Valuation Report is an in-depth analysis detailing your home's value as well as a comparison with similar homes in the area
Home Values in the Area
Average Home Value in this Area
Purchase History
| Date | Buyer | Sale Price | Title Company |
|---|---|---|---|
| Demes William | $195,000 | -- |
Source: Public Records
Mortgage History
| Date | Status | Borrower | Loan Amount |
|---|---|---|---|
| Open | Demes William | $195,000 |
Source: Public Records
Tax History
| Year | Tax Paid | Tax Assessment Tax Assessment Total Assessment is a certain percentage of the fair market value that is determined by local assessors to be the total taxable value of land and additions on the property. | Land | Improvement |
|---|---|---|---|---|
| 2025 | $8,825 | $520,100 | $317,100 | $203,000 |
| 2024 | $8,898 | $463,700 | $204,600 | $259,100 |
Source: Public Records
Map
Nearby Homes
- 45 Mitchell Ave
- 236 Highland Ave
- 255 Resnik Ct
- 80 Mitchell Ave
- 88 Emerson Rd
- 5265 Witherspoon St
- 96 Emerson Rd
- 129 Hampton Ct
- 127 Hampton Ct
- 4 Seymour Terrace
- 46 Carlisle Ct
- 3 Webster Rd
- 212 Elizabeth Ave
- 4 Winthrop Rd
- 266 Dochery Place
- 24 Conerly Rd
- 223 Plainfield Ave
- 2603 Wade St
- 23 Newkirk Rd
- 36 Cherrywood Dr
Your Personal Tour Guide
Ask me questions while you tour the home.