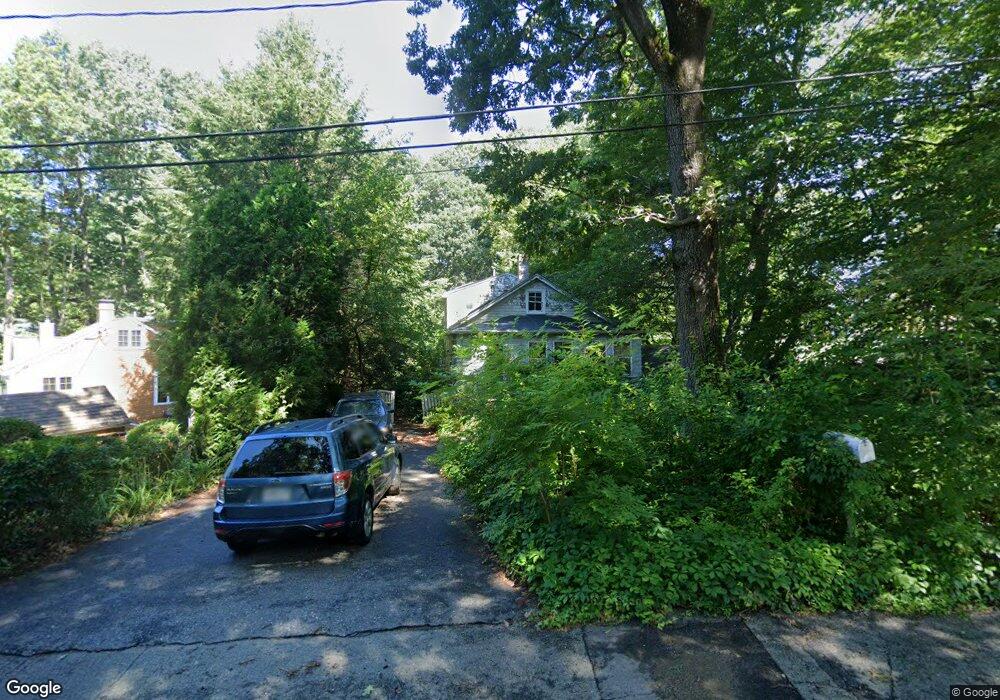
6 Park Ln Wayland, MA 01778
Estimated Value: $729,000 - $992,000
4
Beds
2
Baths
1,632
Sq Ft
$529/Sq Ft
Est. Value
About This Home
This home is located at 6 Park Ln, Wayland, MA 01778 and is currently estimated at $863,663, approximately $529 per square foot. 6 Park Ln is a home located in Middlesex County with nearby schools including Wayland High School, Christa McAuliffe Charter School, and Veritas Christian Academy.
Ownership History
Date
Name
Owned For
Owner Type
Purchase Details
Closed on
Jul 31, 2002
Sold by
Sciaba Gregg A
Bought by
Kalanzis Peter and Kalanzis Nina
Current Estimated Value
Home Financials for this Owner
Home Financials are based on the most recent Mortgage that was taken out on this home.
Original Mortgage
$356,000
Outstanding Balance
$151,610
Interest Rate
6.64%
Mortgage Type
Purchase Money Mortgage
Estimated Equity
$712,053
Purchase Details
Closed on
Jun 17, 1994
Sold by
Vitello William C and Vitello Janet S
Bought by
Sciaba Gregg A
Create a Home Valuation Report for This Property
The Home Valuation Report is an in-depth analysis detailing your home's value as well as a comparison with similar homes in the area
Home Values in the Area
Average Home Value in this Area
Purchase History
| Date | Buyer | Sale Price | Title Company |
|---|---|---|---|
| Kalanzis Peter | $445,000 | -- | |
| Kalanzis Peter | $445,000 | -- | |
| Sciaba Gregg A | $150,000 | -- |
Source: Public Records
Mortgage History
| Date | Status | Borrower | Loan Amount |
|---|---|---|---|
| Open | Kalanzis Peter | $356,000 | |
| Closed | Sciaba Gregg A | $356,000 | |
| Previous Owner | Sciaba Gregg A | $327,250 |
Source: Public Records
Tax History Compared to Growth
Tax History
| Year | Tax Paid | Tax Assessment Tax Assessment Total Assessment is a certain percentage of the fair market value that is determined by local assessors to be the total taxable value of land and additions on the property. | Land | Improvement |
|---|---|---|---|---|
| 2025 | $9,686 | $619,700 | $390,600 | $229,100 |
| 2024 | $9,172 | $591,000 | $371,900 | $219,100 |
| 2023 | $8,901 | $534,600 | $338,100 | $196,500 |
| 2022 | $8,814 | $480,300 | $280,000 | $200,300 |
| 2021 | $7,982 | $431,000 | $254,500 | $176,500 |
| 2020 | $7,520 | $423,400 | $254,500 | $168,900 |
| 2019 | $7,221 | $395,000 | $242,400 | $152,600 |
| 2018 | $6,945 | $385,200 | $242,400 | $142,800 |
| 2017 | $6,643 | $366,200 | $230,900 | $135,300 |
| 2016 | $6,272 | $361,700 | $226,400 | $135,300 |
| 2015 | $6,674 | $362,900 | $226,400 | $136,500 |
Source: Public Records
Map
Nearby Homes
- 22 Lakeshore Dr
- 47 Pequot Rd
- 37 Pequot Rd
- 96 Lakeshore Dr
- 96 Lake Shore Dr
- 108 Dudley Rd
- 353 Old Connecticut Path
- 26 Dudley Rd
- 15 Crest Rd
- 123 Dudley Rd
- 260 Cochituate Rd
- 233 Lakeshore Dr
- 3 Keith Rd
- 454 Old Connecticut Path
- 35 Wallace Rd
- 208 Cochituate Rd
- 28 Joyce Rd
- 177 Main St
- 15 Parkridge Rd
- 11 White Pine Knoll Rd