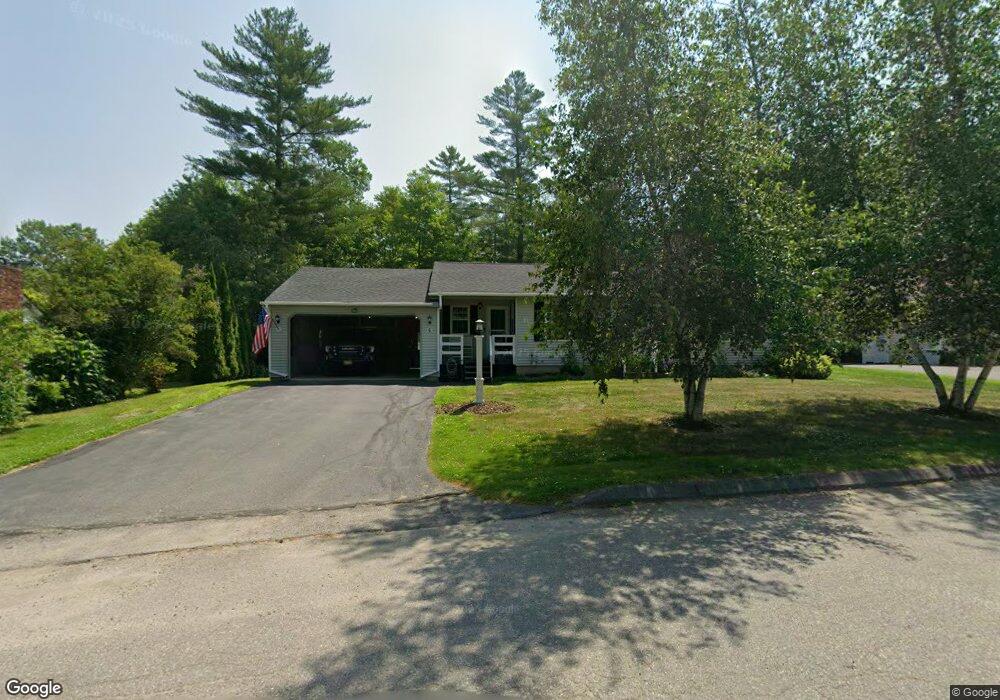
6 Paul St Winslow, ME 04901
Estimated Value: $296,000 - $305,717
2
Beds
2
Baths
1,116
Sq Ft
$270/Sq Ft
Est. Value
About This Home
This home is located at 6 Paul St, Winslow, ME 04901 and is currently estimated at $301,679, approximately $270 per square foot. 6 Paul St is a home located in Kennebec County with nearby schools including Winslow Elementary School, Winslow Junior High School, and Winslow High School.
Ownership History
Date
Name
Owned For
Owner Type
Purchase Details
Closed on
May 31, 2017
Sold by
Brann Natalie J Est
Bought by
White Donna
Current Estimated Value
Home Financials for this Owner
Home Financials are based on the most recent Mortgage that was taken out on this home.
Original Mortgage
$90,000
Outstanding Balance
$74,759
Interest Rate
3.97%
Mortgage Type
New Conventional
Estimated Equity
$226,921
Purchase Details
Closed on
Mar 7, 2005
Sold by
Desrosiers Muriel C and Desrosiers Albert A
Bought by
Brann Natalie J and Brann Richard W
Create a Home Valuation Report for This Property
The Home Valuation Report is an in-depth analysis detailing your home's value as well as a comparison with similar homes in the area
Home Values in the Area
Average Home Value in this Area
Purchase History
| Date | Buyer | Sale Price | Title Company |
|---|---|---|---|
| White Donna | -- | -- | |
| Brann Natalie J | -- | -- |
Source: Public Records
Mortgage History
| Date | Status | Borrower | Loan Amount |
|---|---|---|---|
| Open | White Donna | $90,000 |
Source: Public Records
Tax History
| Year | Tax Paid | Tax Assessment Tax Assessment Total Assessment is a certain percentage of the fair market value that is determined by local assessors to be the total taxable value of land and additions on the property. | Land | Improvement |
|---|---|---|---|---|
| 2024 | $3,528 | $235,200 | $37,500 | $197,700 |
| 2023 | $3,528 | $235,200 | $37,500 | $197,700 |
| 2022 | $2,381 | $136,600 | $24,500 | $112,100 |
| 2021 | $2,703 | $133,800 | $24,500 | $109,300 |
| 2020 | $2,518 | $133,800 | $24,500 | $109,300 |
| 2019 | $2,494 | $133,800 | $24,500 | $109,300 |
| 2018 | $2,400 | $133,800 | $24,500 | $109,300 |
| 2017 | $2,240 | $133,800 | $24,500 | $109,300 |
| 2016 | $2,106 | $133,800 | $24,500 | $109,300 |
| 2015 | $2,074 | $133,800 | $24,500 | $109,300 |
| 2014 | $2,074 | $133,800 | $24,500 | $109,300 |
Source: Public Records
Map
Nearby Homes
Your Personal Tour Guide
Ask me questions while you tour the home.