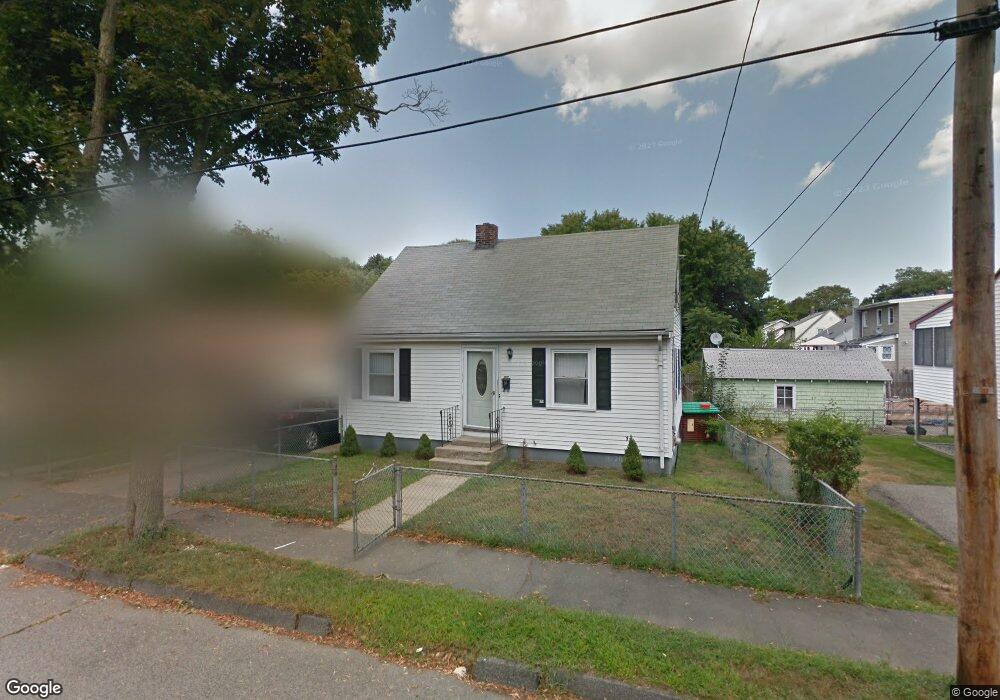
6 Payson St Quincy, MA 02169
South Quincy NeighborhoodEstimated Value: $559,000 - $629,000
3
Beds
1
Bath
1,080
Sq Ft
$547/Sq Ft
Est. Value
About This Home
This home is located at 6 Payson St, Quincy, MA 02169 and is currently estimated at $591,013, approximately $547 per square foot. 6 Payson St is a home located in Norfolk County with nearby schools including Lincoln-Hancock Community School, South West Middle School, and Quincy High School.
Ownership History
Date
Name
Owned For
Owner Type
Purchase Details
Closed on
Dec 16, 1996
Sold by
Cromp Fred E and Cromp Barbara J
Bought by
Brown Stephen M and Brown Lisa M
Current Estimated Value
Home Financials for this Owner
Home Financials are based on the most recent Mortgage that was taken out on this home.
Original Mortgage
$114,000
Outstanding Balance
$10,899
Interest Rate
7.75%
Mortgage Type
Purchase Money Mortgage
Estimated Equity
$580,114
Create a Home Valuation Report for This Property
The Home Valuation Report is an in-depth analysis detailing your home's value as well as a comparison with similar homes in the area
Home Values in the Area
Average Home Value in this Area
Purchase History
| Date | Buyer | Sale Price | Title Company |
|---|---|---|---|
| Brown Stephen M | $122,500 | -- |
Source: Public Records
Mortgage History
| Date | Status | Borrower | Loan Amount |
|---|---|---|---|
| Open | Brown Stephen M | $114,000 |
Source: Public Records
Tax History
| Year | Tax Paid | Tax Assessment Tax Assessment Total Assessment is a certain percentage of the fair market value that is determined by local assessors to be the total taxable value of land and additions on the property. | Land | Improvement |
|---|---|---|---|---|
| 2025 | $5,697 | $494,100 | $272,600 | $221,500 |
| 2024 | $5,401 | $479,200 | $259,600 | $219,600 |
| 2023 | $4,914 | $441,500 | $236,000 | $205,500 |
| 2022 | $4,654 | $388,500 | $196,700 | $191,800 |
| 2021 | $4,631 | $381,500 | $196,700 | $184,800 |
| 2020 | $4,659 | $374,800 | $196,700 | $178,100 |
| 2019 | $4,306 | $343,100 | $185,600 | $157,500 |
| 2018 | $4,251 | $318,700 | $171,900 | $146,800 |
| 2017 | $4,085 | $288,300 | $163,700 | $124,600 |
| 2016 | $3,731 | $259,800 | $142,300 | $117,500 |
| 2015 | $3,722 | $254,900 | $142,300 | $112,600 |
| 2014 | $3,555 | $239,200 | $142,300 | $96,900 |
Source: Public Records
Map
Nearby Homes
- 8 Jackson St Unit B1
- 8 Jackson St Unit B4
- 171-175 Granite St
- 87 Franklin St Unit 105
- 56 Penn St Unit 4
- 52 Packards Ln Unit 4
- 91 Garfield St
- 59 Packards Ln Unit 5
- 59 Packards Ln Unit 1
- 59 Packards Ln Unit 3
- 50 N Payne St Unit 6
- 21 Arthur St
- 132 Centre St
- 177 Franklin St
- 81-85 Water St
- 293 Whitwell St
- 21 Totman St Unit 205
- 21 Totman St Unit 409
- 21 Totman St Unit 203
- 21 Totman St Unit 403
Your Personal Tour Guide
Ask me questions while you tour the home.