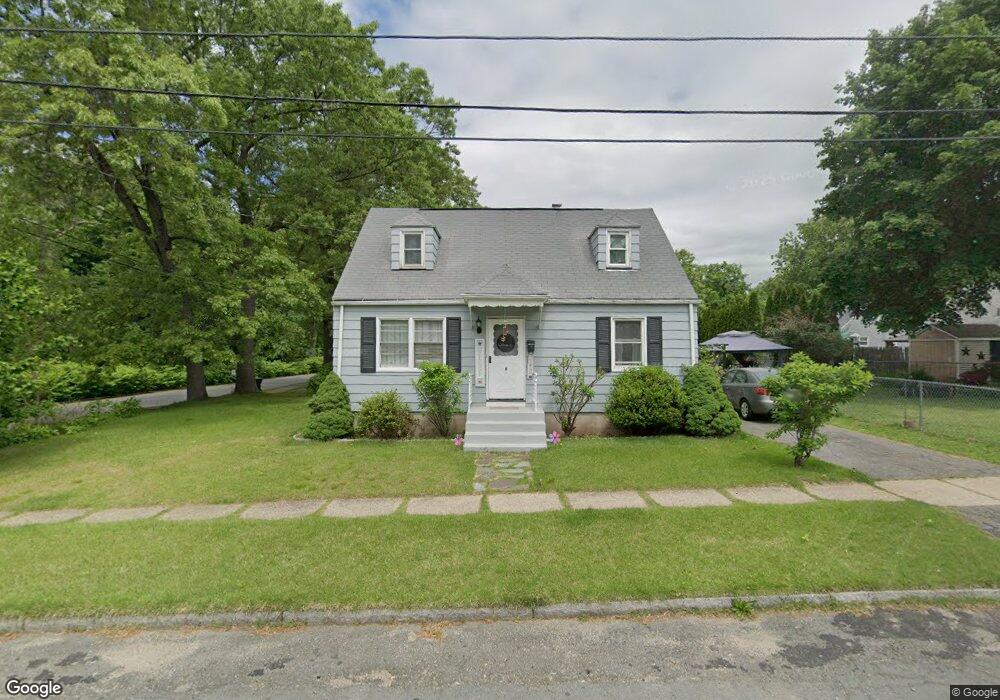
6 Pear St Springfield, MA 01109
Pine Point NeighborhoodEstimated Value: $222,325 - $300,000
3
Beds
1
Bath
1,116
Sq Ft
$244/Sq Ft
Est. Value
About This Home
This home is located at 6 Pear St, Springfield, MA 01109 and is currently estimated at $272,081, approximately $243 per square foot. 6 Pear St is a home located in Hampden County with nearby schools including Frank H. Freedman School, John J Duggan Middle, and Springfield Central High School.
Ownership History
Date
Name
Owned For
Owner Type
Purchase Details
Closed on
Jan 2, 2009
Sold by
Mcmaster Charles M and Mastioanni Mary
Bought by
Amos Heather L
Current Estimated Value
Home Financials for this Owner
Home Financials are based on the most recent Mortgage that was taken out on this home.
Original Mortgage
$75,060
Outstanding Balance
$49,677
Interest Rate
6.08%
Mortgage Type
Purchase Money Mortgage
Estimated Equity
$222,404
Purchase Details
Closed on
May 5, 2004
Sold by
Mcmaster Carolyn
Bought by
Mcmaster Charles M and Mastioanni Mary
Create a Home Valuation Report for This Property
The Home Valuation Report is an in-depth analysis detailing your home's value as well as a comparison with similar homes in the area
Home Values in the Area
Average Home Value in this Area
Purchase History
| Date | Buyer | Sale Price | Title Company |
|---|---|---|---|
| Amos Heather L | $98,000 | -- | |
| Mcmaster Charles M | -- | -- |
Source: Public Records
Mortgage History
| Date | Status | Borrower | Loan Amount |
|---|---|---|---|
| Open | Amos Heather L | $75,060 |
Source: Public Records
Tax History
| Year | Tax Paid | Tax Assessment Tax Assessment Total Assessment is a certain percentage of the fair market value that is determined by local assessors to be the total taxable value of land and additions on the property. | Land | Improvement |
|---|---|---|---|---|
| 2025 | $2,697 | $172,000 | $39,300 | $132,700 |
| 2024 | $2,431 | $151,400 | $32,800 | $118,600 |
| 2023 | $2,407 | $141,200 | $29,800 | $111,400 |
| 2022 | $2,556 | $135,800 | $27,800 | $108,000 |
| 2021 | $2,389 | $126,400 | $25,300 | $101,100 |
| 2020 | $2,209 | $113,100 | $25,300 | $87,800 |
| 2019 | $1,942 | $98,700 | $25,300 | $73,400 |
| 2018 | $2,003 | $101,800 | $25,300 | $76,500 |
| 2017 | $1,714 | $87,200 | $23,400 | $63,800 |
| 2016 | $1,592 | $81,000 | $23,400 | $57,600 |
| 2015 | $1,613 | $82,000 | $23,400 | $58,600 |
Source: Public Records
Map
Nearby Homes
- 197 Seymour Ave
- 5 Pear St
- 16 Pear St
- 220 Pheland St
- 189 Seymour Ave
- 15 Pear St
- 219 Seymour Ave
- 219 Seymour Ave Unit 219
- 214 Pheland St
- 183 Seymour Ave
- 242 Pheland St
- 223 Seymour Ave
- 206 Pheland St
- 184 Seymour Ave
- 248 Pheland St Unit 1
- 229 Seymour Ave
- 32 Pear St
- 219 Pheland St
- 31 Pear St
- 213 Pheland St
Your Personal Tour Guide
Ask me questions while you tour the home.