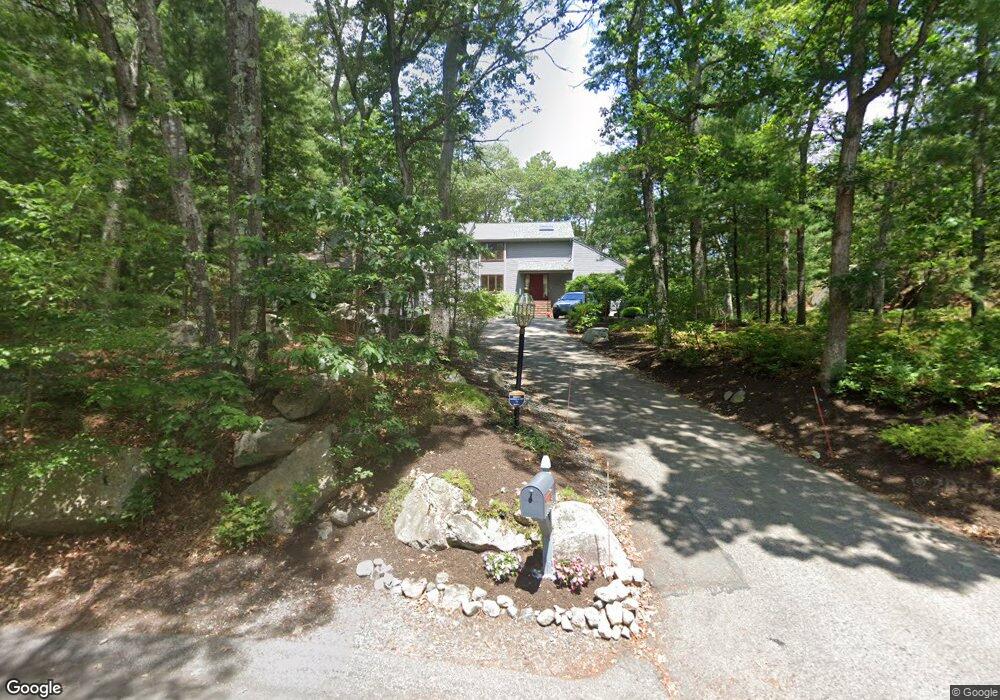
6 Pequot Cir Sharon, MA 02067
Estimated Value: $1,202,000 - $1,324,000
5
Beds
4
Baths
3,881
Sq Ft
$326/Sq Ft
Est. Value
About This Home
This home is located at 6 Pequot Cir, Sharon, MA 02067 and is currently estimated at $1,264,714, approximately $325 per square foot. 6 Pequot Cir is a home located in Norfolk County with nearby schools including Heights Elementary School, Sharon Middle School, and Sharon High School.
Ownership History
Date
Name
Owned For
Owner Type
Purchase Details
Closed on
Mar 4, 2020
Sold by
Gardos Euphemia G
Bought by
Gardos Ft
Current Estimated Value
Purchase Details
Closed on
Oct 1, 1981
Bought by
Gardos George
Create a Home Valuation Report for This Property
The Home Valuation Report is an in-depth analysis detailing your home's value as well as a comparison with similar homes in the area
Home Values in the Area
Average Home Value in this Area
Purchase History
| Date | Buyer | Sale Price | Title Company |
|---|---|---|---|
| Gardos Ft | -- | None Available | |
| Gardos George | -- | -- |
Source: Public Records
Mortgage History
| Date | Status | Borrower | Loan Amount |
|---|---|---|---|
| Previous Owner | Gardos George | $265,000 | |
| Previous Owner | Gardos George | $48,000 | |
| Previous Owner | Gardos George | $150,000 |
Source: Public Records
Tax History Compared to Growth
Tax History
| Year | Tax Paid | Tax Assessment Tax Assessment Total Assessment is a certain percentage of the fair market value that is determined by local assessors to be the total taxable value of land and additions on the property. | Land | Improvement |
|---|---|---|---|---|
| 2025 | $17,782 | $1,017,300 | $428,300 | $589,000 |
| 2024 | $17,084 | $971,800 | $393,000 | $578,800 |
| 2023 | $16,153 | $868,900 | $367,500 | $501,400 |
| 2022 | $15,470 | $783,300 | $306,100 | $477,200 |
| 2021 | $15,349 | $751,300 | $288,700 | $462,600 |
| 2020 | $14,275 | $751,300 | $288,700 | $462,600 |
| 2019 | $15,165 | $781,300 | $255,500 | $525,800 |
| 2018 | $15,037 | $776,300 | $250,500 | $525,800 |
| 2017 | $14,913 | $760,100 | $234,300 | $525,800 |
| 2016 | $14,357 | $713,900 | $234,300 | $479,600 |
| 2015 | $14,159 | $697,500 | $214,900 | $482,600 |
| 2014 | $13,136 | $639,200 | $195,400 | $443,800 |
Source: Public Records
Map
Nearby Homes
- Lot One Old Wolomolopoag St
- Lot Two Old Wolomolopoag St
- 28 Norfolk Place
- 111 E Foxboro St
- 630 S Main St
- 668 S Main St
- 285 Massapoag Ave
- 89 Oak St
- 27 Henry St
- 91 Old Post Rd
- 97 Old Post Rd
- 170 Cannon Forge Dr
- 71 Morse St
- 180 Old Post Rd Unit 202
- 180 Old Post Rd Unit 206
- 180 Old Post Rd Unit 201
- 180 Old Post Rd Unit 405
- 180 Old Post Rd Unit 207
- 132 Cannon Forge Dr
- 1 Roseland St Unit A-1