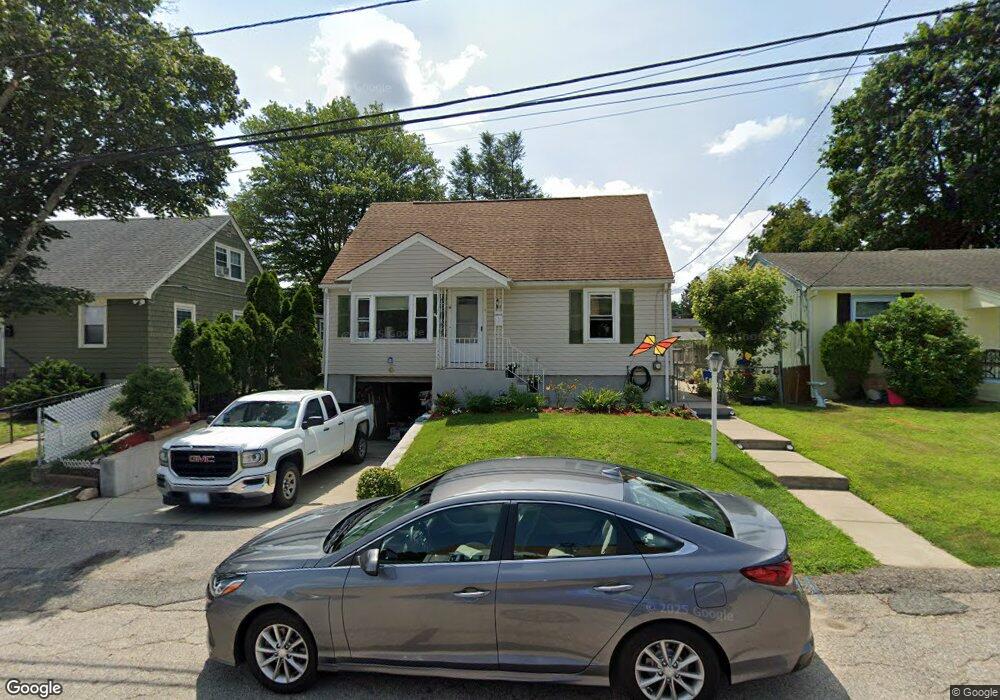
6 Pershing Rd Johnston, RI 02919
Killingly Street NeighborhoodEstimated Value: $366,618 - $448,000
3
Beds
1
Bath
1,248
Sq Ft
$317/Sq Ft
Est. Value
About This Home
This home is located at 6 Pershing Rd, Johnston, RI 02919 and is currently estimated at $395,405, approximately $316 per square foot. 6 Pershing Rd is a home located in Providence County with nearby schools including Johnston Senior High School, Achievement First Promesa, and Achievement First Providence Mayoral Academy Elementary School.
Ownership History
Date
Name
Owned For
Owner Type
Purchase Details
Closed on
Jun 12, 2001
Sold by
Monti Joseph M
Bought by
Jackson Michele A
Current Estimated Value
Home Financials for this Owner
Home Financials are based on the most recent Mortgage that was taken out on this home.
Original Mortgage
$129,540
Interest Rate
7.08%
Purchase Details
Closed on
Mar 11, 1994
Sold by
Monti John and Monti Marie
Bought by
Monti Joseph M
Create a Home Valuation Report for This Property
The Home Valuation Report is an in-depth analysis detailing your home's value as well as a comparison with similar homes in the area
Home Values in the Area
Average Home Value in this Area
Purchase History
| Date | Buyer | Sale Price | Title Company |
|---|---|---|---|
| Jackson Michele A | $127,000 | -- | |
| Monti Joseph M | $100,000 | -- | |
| Jackson Michele A | $127,000 | -- | |
| Monti Joseph M | $100,000 | -- |
Source: Public Records
Mortgage History
| Date | Status | Borrower | Loan Amount |
|---|---|---|---|
| Open | Monti Joseph M | $35,000 | |
| Open | Monti Joseph M | $171,436 | |
| Closed | Monti Joseph M | $129,540 |
Source: Public Records
Tax History
| Year | Tax Paid | Tax Assessment Tax Assessment Total Assessment is a certain percentage of the fair market value that is determined by local assessors to be the total taxable value of land and additions on the property. | Land | Improvement |
|---|---|---|---|---|
| 2025 | $4,456 | $285,300 | $74,900 | $210,400 |
| 2024 | $4,365 | $285,300 | $74,900 | $210,400 |
| 2023 | $4,365 | $285,300 | $74,900 | $210,400 |
| 2022 | $4,325 | $186,100 | $57,600 | $128,500 |
| 2021 | $4,325 | $186,100 | $57,600 | $128,500 |
| 2018 | $4,426 | $161,000 | $50,300 | $110,700 |
| 2016 | $5,856 | $161,000 | $50,300 | $110,700 |
| 2015 | $4,322 | $149,100 | $52,600 | $96,500 |
| 2014 | $4,287 | $149,100 | $52,600 | $96,500 |
| 2013 | $4,287 | $149,100 | $52,600 | $96,500 |
Source: Public Records
Map
Nearby Homes
- 33 Harding Ave
- 0 Orchard St Unit 1396400
- 0 Orchard St Unit 1400488
- 0 Orchard St Unit 1395201
- 10 Mott St
- 19 S Long St
- 27 Aurelia Dr
- 17 Middleton St
- 60 Ophelia St
- 102 Ophelia St
- 56 N Olney St
- 32 Harrington Dr
- 236 Lowell Ave
- 15 Melissa St
- 665 Plainfield St
- 231 Lowell Ave
- 129 Glenbridge Ave
- 162 Merino St
- 18 Crowninshield St
- 0 Ipswich St
Your Personal Tour Guide
Ask me questions while you tour the home.