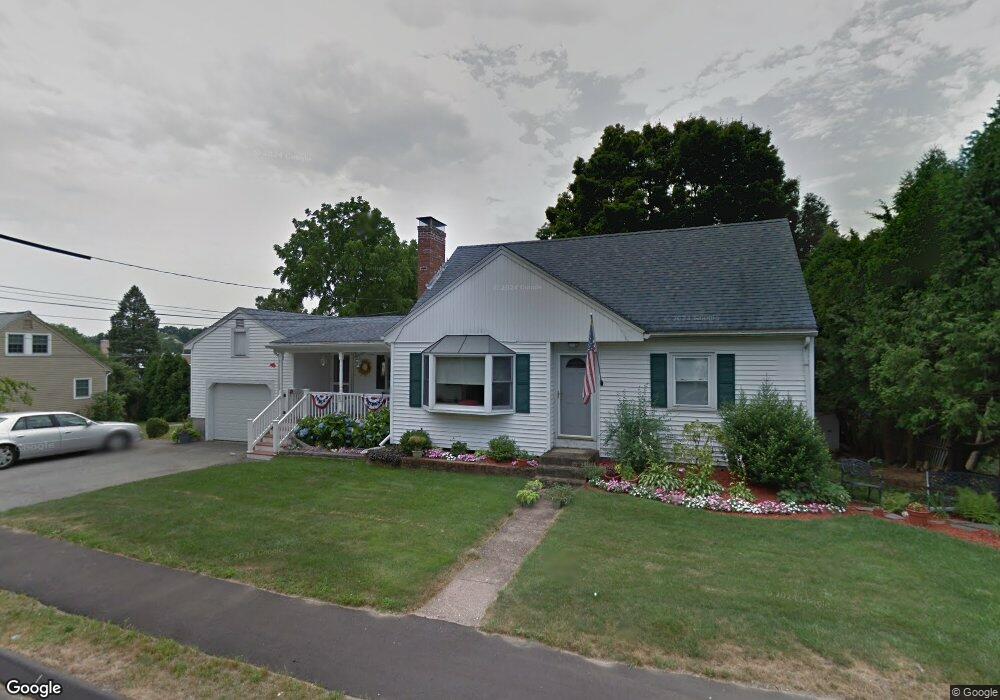
6 Phillips St Unit R Woburn, MA 01801
Mishawum NeighborhoodEstimated Value: $761,000 - $936,000
3
Beds
2
Baths
2,016
Sq Ft
$425/Sq Ft
Est. Value
About This Home
This home is located at 6 Phillips St Unit R, Woburn, MA 01801 and is currently estimated at $856,036, approximately $424 per square foot. 6 Phillips St Unit R is a home located in Middlesex County with nearby schools including Wyman Elementary School, John F. Kennedy Middle School, and Woburn High School.
Ownership History
Date
Name
Owned For
Owner Type
Purchase Details
Closed on
Apr 29, 1987
Sold by
Layman John E
Bought by
Layman Andrew
Current Estimated Value
Create a Home Valuation Report for This Property
The Home Valuation Report is an in-depth analysis detailing your home's value as well as a comparison with similar homes in the area
Home Values in the Area
Average Home Value in this Area
Purchase History
| Date | Buyer | Sale Price | Title Company |
|---|---|---|---|
| Layman Andrew | $37,500 | -- |
Source: Public Records
Mortgage History
| Date | Status | Borrower | Loan Amount |
|---|---|---|---|
| Open | Layman Andrew | $34,000 | |
| Closed | Layman Andrew | $150,000 | |
| Closed | Layman Andrew | $10,500 |
Source: Public Records
Tax History Compared to Growth
Tax History
| Year | Tax Paid | Tax Assessment Tax Assessment Total Assessment is a certain percentage of the fair market value that is determined by local assessors to be the total taxable value of land and additions on the property. | Land | Improvement |
|---|---|---|---|---|
| 2025 | $6,384 | $747,500 | $360,700 | $386,800 |
| 2024 | $5,852 | $726,000 | $343,500 | $382,500 |
| 2023 | $5,711 | $656,400 | $312,300 | $344,100 |
| 2022 | $5,555 | $594,800 | $271,600 | $323,200 |
| 2021 | $5,330 | $571,300 | $258,600 | $312,700 |
| 2020 | $5,146 | $552,100 | $258,600 | $293,500 |
| 2019 | $5,081 | $534,800 | $246,300 | $288,500 |
| 2018 | $4,883 | $493,700 | $225,900 | $267,800 |
| 2017 | $4,544 | $457,100 | $215,200 | $241,900 |
| 2016 | $4,341 | $431,900 | $201,100 | $230,800 |
| 2015 | $4,183 | $411,300 | $187,900 | $223,400 |
| 2014 | $4,127 | $395,300 | $187,900 | $207,400 |
Source: Public Records
Map
Nearby Homes
- 52 Middle St
- 38 Middle St
- 0 Fryeburg Rd
- 4 Maywood Terrace
- 3 Highet Ave
- 8 Clinton St
- 12 Mishawum Rd
- 74 Beach St Unit 6-12
- 74 Beach St Unit 3
- 6 Callahan Dr
- 602 Main St Unit 1
- 3 Hart St
- 166 Place Ln Unit 166
- 168 Place Ln
- 14 Church Ave
- 14 Church Ave Unit 2
- 18 Hamilton Rd
- 20 Barbara Cir
- 104 Forest Park Rd
- 37 1/2 Chestnut St