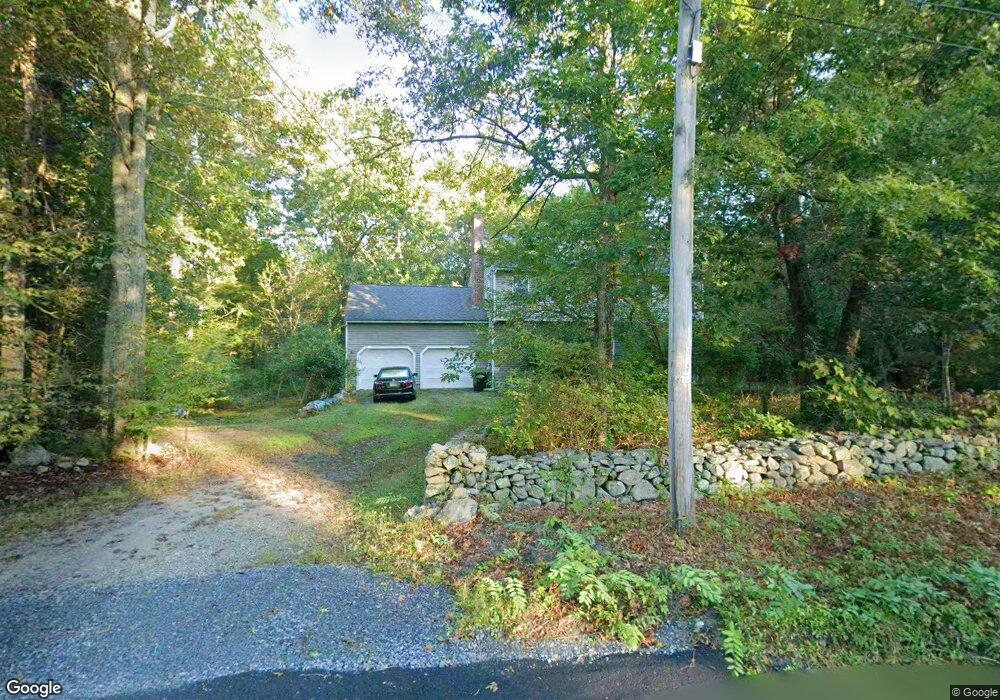
6 Plain St Rehoboth, MA 02769
Estimated Value: $633,000 - $733,000
4
Beds
3
Baths
2,166
Sq Ft
$311/Sq Ft
Est. Value
About This Home
This home is located at 6 Plain St, Rehoboth, MA 02769 and is currently estimated at $674,626, approximately $311 per square foot. 6 Plain St is a home located in Bristol County with nearby schools including Dighton-Rehoboth Regional High School and Cedar Brook School.
Ownership History
Date
Name
Owned For
Owner Type
Purchase Details
Closed on
Mar 7, 2019
Sold by
Fazio Guido M
Bought by
Guido M & Paula F Fazio Ft
Current Estimated Value
Purchase Details
Closed on
Sep 25, 1989
Sold by
Ruel Joseph O
Bought by
Fazio Guido M
Home Financials for this Owner
Home Financials are based on the most recent Mortgage that was taken out on this home.
Original Mortgage
$120,000
Interest Rate
9.82%
Mortgage Type
Purchase Money Mortgage
Create a Home Valuation Report for This Property
The Home Valuation Report is an in-depth analysis detailing your home's value as well as a comparison with similar homes in the area
Home Values in the Area
Average Home Value in this Area
Purchase History
| Date | Buyer | Sale Price | Title Company |
|---|---|---|---|
| Guido M & Paula F Fazio Ft | -- | -- | |
| Fazio Guido M | $229,900 | -- |
Source: Public Records
Mortgage History
| Date | Status | Borrower | Loan Amount |
|---|---|---|---|
| Previous Owner | Fazio Guido M | $120,000 | |
| Previous Owner | Fazio Guido M | $95,000 |
Source: Public Records
Tax History
| Year | Tax Paid | Tax Assessment Tax Assessment Total Assessment is a certain percentage of the fair market value that is determined by local assessors to be the total taxable value of land and additions on the property. | Land | Improvement |
|---|---|---|---|---|
| 2025 | $55 | $494,400 | $190,400 | $304,000 |
| 2024 | $5,343 | $470,300 | $173,100 | $297,200 |
| 2023 | $4,930 | $430,100 | $169,500 | $260,600 |
| 2022 | $4,930 | $389,100 | $169,500 | $219,600 |
| 2021 | $4,907 | $370,600 | $161,700 | $208,900 |
| 2020 | $4,862 | $370,600 | $161,700 | $208,900 |
| 2018 | $4,199 | $350,800 | $153,900 | $196,900 |
| 2017 | $4,097 | $326,200 | $153,900 | $172,300 |
| 2016 | $3,963 | $326,200 | $153,900 | $172,300 |
| 2015 | $3,746 | $304,300 | $146,700 | $157,600 |
| 2014 | $3,696 | $297,100 | $139,500 | $157,600 |
Source: Public Records
Map
Nearby Homes
Your Personal Tour Guide
Ask me questions while you tour the home.