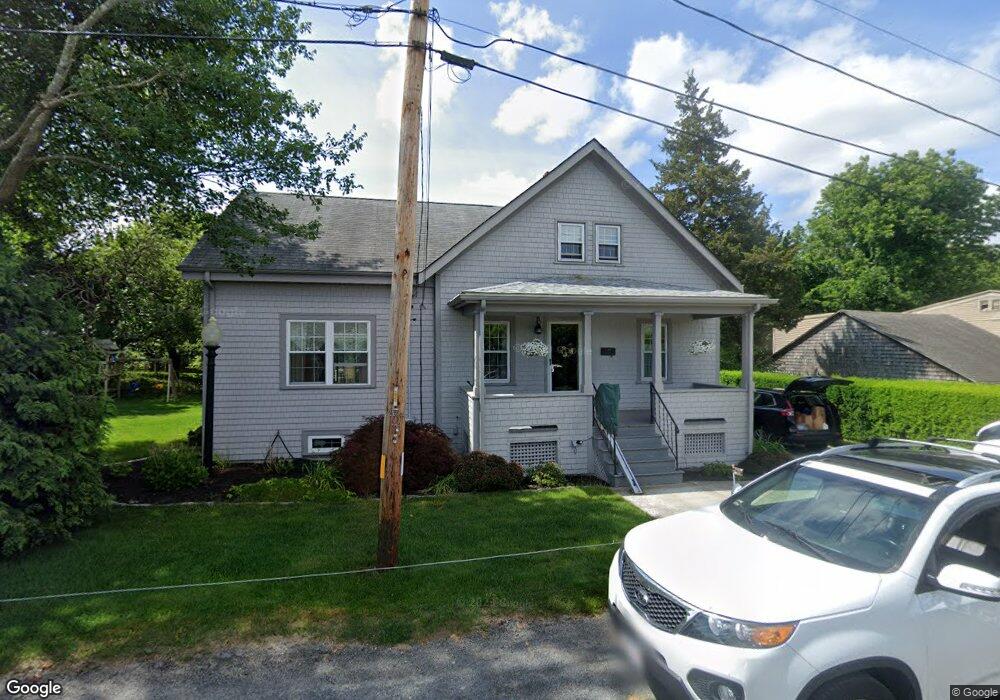
6 Pleasant St Acushnet, MA 02743
North Fairhaven NeighborhoodEstimated Value: $337,000 - $452,000
Studio
1
Bath
1,606
Sq Ft
$247/Sq Ft
Est. Value
About This Home
This home is located at 6 Pleasant St, Acushnet, MA 02743 and is currently estimated at $397,269, approximately $247 per square foot. 6 Pleasant St is a home located in Bristol County with nearby schools including Acushnet Elementary School, Albert F Ford Middle School, and Alma Del Mar Charter School.
Ownership History
Date
Name
Owned For
Owner Type
Purchase Details
Closed on
Aug 30, 2022
Sold by
Pequita Thomas E and Pequita Debra J
Bought by
Pequita Thomas E and Pequita Debra J
Current Estimated Value
Purchase Details
Closed on
Jun 24, 1980
Bought by
Pequita Thomas E and Pequita Oliveira D
Create a Home Valuation Report for This Property
The Home Valuation Report is an in-depth analysis detailing your home's value as well as a comparison with similar homes in the area
Home Values in the Area
Average Home Value in this Area
Purchase History
| Date | Buyer | Sale Price | Title Company |
|---|---|---|---|
| Pequita Thomas E | -- | None Available | |
| Pequita Thomas E | -- | -- |
Source: Public Records
Mortgage History
| Date | Status | Borrower | Loan Amount |
|---|---|---|---|
| Previous Owner | Pequita Thomas E | $59,000 | |
| Previous Owner | Pequita Thomas E | $31,500 | |
| Previous Owner | Pequita Thomas E | $28,200 |
Source: Public Records
Tax History
| Year | Tax Paid | Tax Assessment Tax Assessment Total Assessment is a certain percentage of the fair market value that is determined by local assessors to be the total taxable value of land and additions on the property. | Land | Improvement |
|---|---|---|---|---|
| 2025 | $40 | $369,500 | $93,400 | $276,100 |
| 2024 | $3,826 | $335,300 | $89,100 | $246,200 |
| 2023 | $3,871 | $322,600 | $80,400 | $242,200 |
| 2022 | $3,826 | $288,300 | $76,000 | $212,300 |
| 2021 | $3,536 | $255,700 | $76,000 | $179,700 |
| 2020 | $3,564 | $255,700 | $76,000 | $179,700 |
| 2019 | $3,320 | $234,100 | $67,400 | $166,700 |
| 2018 | $3,203 | $222,100 | $67,400 | $154,700 |
| 2017 | $3,092 | $214,100 | $67,400 | $146,700 |
| 2016 | $3,015 | $207,500 | $67,400 | $140,100 |
| 2015 | $2,766 | $193,700 | $67,400 | $126,300 |
Source: Public Records
Map
Nearby Homes
Your Personal Tour Guide
Ask me questions while you tour the home.