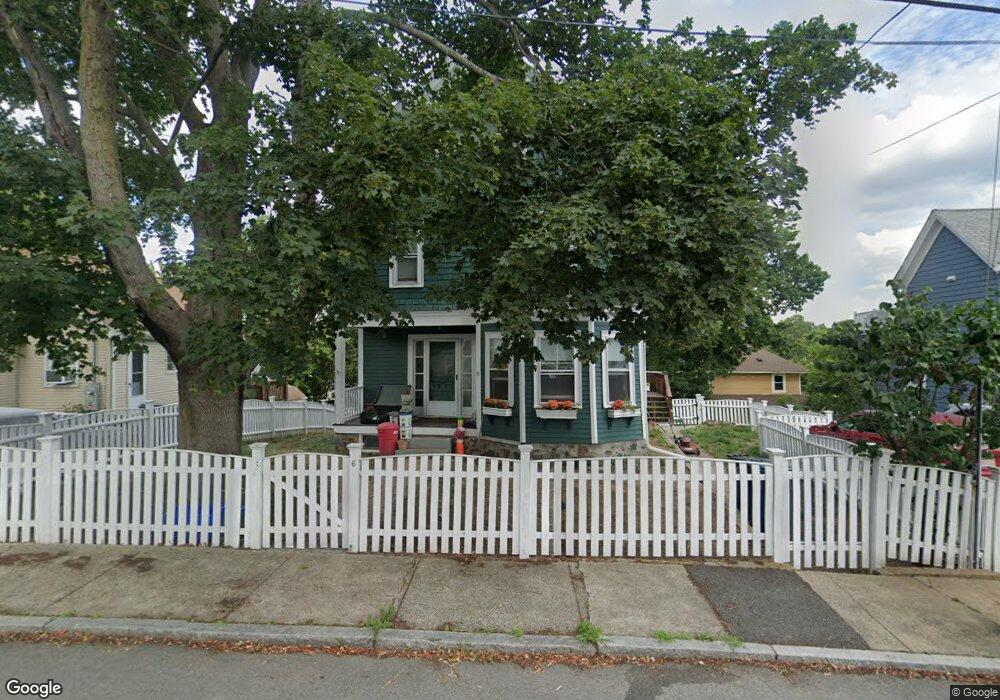
6 Plymouth St Salem, MA 01970
South Salem NeighborhoodEstimated Value: $766,000 - $807,000
4
Beds
3
Baths
2,054
Sq Ft
$380/Sq Ft
Est. Value
About This Home
This home is located at 6 Plymouth St, Salem, MA 01970 and is currently estimated at $780,831, approximately $380 per square foot. 6 Plymouth St is a home located in Essex County with nearby schools including Saltonstall School, Horace Mann Laboratory, and Carlton Elementary School.
Ownership History
Date
Name
Owned For
Owner Type
Purchase Details
Closed on
Oct 19, 2007
Sold by
Bouchard Doris E
Bought by
Costello Steven and Costello Mary Beth
Current Estimated Value
Purchase Details
Closed on
Feb 28, 2007
Sold by
Webster Katrina D
Bought by
Bouchard Doris E
Purchase Details
Closed on
Feb 27, 2004
Sold by
Canniffe-Mann Catherine and Mann William F
Bought by
Webster Katrina D
Purchase Details
Closed on
Mar 1, 2001
Sold by
Ehrig Gary J and Ehrig Nancy J
Bought by
Mann William F and Canniffe-Man Catherine
Purchase Details
Closed on
Apr 23, 1997
Sold by
Burke Nicholas A and Burke Lisa M
Bought by
Ehrig Gary J and Ehrig Nancy J
Purchase Details
Closed on
Jul 7, 1988
Sold by
Healy Richard J
Bought by
Burke Nicholas A
Create a Home Valuation Report for This Property
The Home Valuation Report is an in-depth analysis detailing your home's value as well as a comparison with similar homes in the area
Home Values in the Area
Average Home Value in this Area
Purchase History
| Date | Buyer | Sale Price | Title Company |
|---|---|---|---|
| Costello Steven | $341,000 | -- | |
| Bouchard Doris E | $416,950 | -- | |
| Webster Katrina D | $345,000 | -- | |
| Mann William F | $259,000 | -- | |
| Ehrig Gary J | $159,000 | -- | |
| Burke Nicholas A | $172,000 | -- |
Source: Public Records
Mortgage History
| Date | Status | Borrower | Loan Amount |
|---|---|---|---|
| Open | Burke Nicholas A | $238,000 | |
| Closed | Burke Nicholas A | $240,000 |
Source: Public Records
Tax History Compared to Growth
Tax History
| Year | Tax Paid | Tax Assessment Tax Assessment Total Assessment is a certain percentage of the fair market value that is determined by local assessors to be the total taxable value of land and additions on the property. | Land | Improvement |
|---|---|---|---|---|
| 2025 | $7,233 | $637,800 | $212,900 | $424,900 |
| 2024 | $7,006 | $602,900 | $202,300 | $400,600 |
| 2023 | $6,799 | $543,500 | $186,700 | $356,800 |
| 2022 | $6,494 | $490,100 | $180,500 | $309,600 |
| 2021 | $6,407 | $464,300 | $168,100 | $296,200 |
| 2020 | $6,043 | $418,200 | $158,700 | $259,500 |
| 2019 | $6,022 | $398,800 | $150,600 | $248,200 |
| 2018 | $5,846 | $380,100 | $143,200 | $236,900 |
| 2017 | $5,469 | $344,800 | $120,800 | $224,000 |
| 2016 | $5,314 | $339,100 | $115,100 | $224,000 |
| 2015 | $5,064 | $308,600 | $105,800 | $202,800 |
Source: Public Records
Map
Nearby Homes
- 17 Cliff St
- 327 Lafayette St Unit 2
- 24 Wisteria St Unit 2
- 4 Willow Ave Unit 2
- 9 Glover St Unit 1
- 59 Leach St Unit 2
- 10 Hazel St Unit 2
- 16 Leavitt St Unit 2
- 7 Fairfield St
- 263 Jefferson Ave
- 9 Lyme St
- 11 Sumner Rd
- 1 Laurent Rd Unit 3
- 32 Park St
- 25 Perkins St
- 10 Horton St
- 288-292 Washington & 5 Porter St Ct
- 29 Willson St
- 25 Calabrese St
- 10 Quadrant Rd