Estimated Value: $132,608 - $171,000
--
Bed
--
Bath
900
Sq Ft
$174/Sq Ft
Est. Value
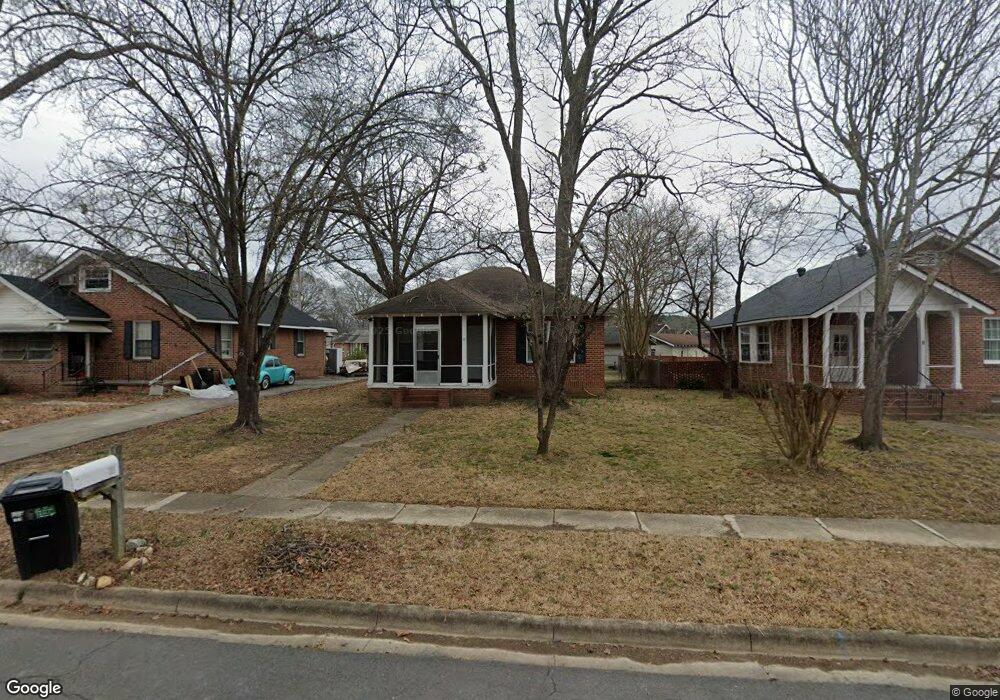
About This Home
This home is located at 6 Poplar St NE, Rome, GA 30161 and is currently estimated at $156,652, approximately $174 per square foot. 6 Poplar St NE is a home located in Floyd County with nearby schools including Model Middle School, Model High School, and Unity Christian School.
Ownership History
Date
Name
Owned For
Owner Type
Purchase Details
Closed on
May 13, 2002
Sold by
Morgan Ii Hugh Dean
Bought by
Wetzel Jason
Current Estimated Value
Purchase Details
Closed on
Nov 30, 1998
Sold by
Morgan Ii Hugh Dean and Morgan Jane M
Bought by
Morgan Ii Hugh Dean
Purchase Details
Closed on
Sep 26, 1997
Sold by
Herring Sherry O
Bought by
Morgan Ii Hugh Dean and Morgan Jane M
Purchase Details
Closed on
Jul 29, 1997
Sold by
Watford Jerry D
Bought by
Herring Sherry O
Purchase Details
Closed on
Sep 15, 1980
Sold by
Line Milburn and Line Oneida
Bought by
Watford Jerry D
Purchase Details
Closed on
Feb 27, 1970
Sold by
Nixon Wilkerson J and Nixon Alton D
Bought by
Line Milburn and Line Oneida
Purchase Details
Closed on
Jun 11, 1969
Sold by
Nixon Alton D
Bought by
Nixon Wilkerson J and Nixon Alton D
Purchase Details
Closed on
Jun 3, 1969
Sold by
Cox James H and Cox Rosemary J
Bought by
Nixon Alton D
Purchase Details
Closed on
Jan 1, 1901
Bought by
Cox James H and Cox Rosemary J
Create a Home Valuation Report for This Property
The Home Valuation Report is an in-depth analysis detailing your home's value as well as a comparison with similar homes in the area
Home Values in the Area
Average Home Value in this Area
Purchase History
| Date | Buyer | Sale Price | Title Company |
|---|---|---|---|
| Wetzel Jason | $61,900 | -- | |
| Morgan Ii Hugh Dean | -- | -- | |
| Morgan Ii Hugh Dean | $50,000 | -- | |
| Herring Sherry O | -- | -- | |
| Watford Jerry D | $16,000 | -- | |
| Line Milburn | $8,000 | -- | |
| Nixon Wilkerson J | -- | -- | |
| Nixon Alton D | $6,000 | -- | |
| Cox James H | -- | -- |
Source: Public Records
Tax History Compared to Growth
Tax History
| Year | Tax Paid | Tax Assessment Tax Assessment Total Assessment is a certain percentage of the fair market value that is determined by local assessors to be the total taxable value of land and additions on the property. | Land | Improvement |
|---|---|---|---|---|
| 2024 | $1,392 | $43,549 | $9,245 | $34,304 |
| 2023 | $1,279 | $39,052 | $8,302 | $30,750 |
| 2022 | $906 | $29,391 | $6,792 | $22,599 |
| 2021 | $845 | $26,907 | $6,792 | $20,115 |
| 2020 | $763 | $24,035 | $5,189 | $18,846 |
| 2019 | $693 | $22,115 | $5,189 | $16,926 |
| 2018 | $657 | $20,893 | $5,189 | $15,704 |
| 2017 | $636 | $20,165 | $5,189 | $14,976 |
| 2016 | $654 | $20,480 | $5,800 | $14,680 |
| 2015 | $778 | $19,120 | $2,440 | $16,680 |
| 2014 | $778 | $25,111 | $2,440 | $22,671 |
Source: Public Records
Map
Nearby Homes
- 0 Cypress St NE Unit 7494593
- 0 Cypress St NE Unit 10422946
- 1 Fir St NE
- 7 Ash St NE
- 42 Dogwood St NE
- 40 Dogwood St NE
- 23 Oak St NE
- 27 Oak St NE
- 205 Couper St NE
- 0 Euclid Ave Unit 10617853
- 541 Reece St NE
- 311 Reynolds St NE
- 2 Lindberg Dr NE
- 219 North Ave NE
- 411 Woodward St NE
- 7 Roseway Cir NE
- 3 Roseway Cir NE
- 23 Reece St NE
- 302 Tolbert St
- 8 Poplar St NE
- 4 Poplar St NE
- 207 Chatillon Rd NE
- 10 Poplar St NE
- 2 Poplar St NE
- 209 Chatillon Rd NE
- 3 Poplar St NE
- 12 Poplar St NE
- 1 Poplar St NE
- 211 Chatillon Rd NE
- 5 Quince St NE
- 7 Poplar St NE
- 14 Poplar St NE
- 201 Chatillon Rd NE
- 9 Poplar St NE
- 3 Quince St NE
- 213 Chatillon Rd NE
- 212 Chatillon Rd NE
- 210 Chatillon Rd NE
- 214 Chatillon Rd NE