Estimated Value: $352,838 - $422,000
--
Bed
--
Bath
2,185
Sq Ft
$182/Sq Ft
Est. Value
About This Home
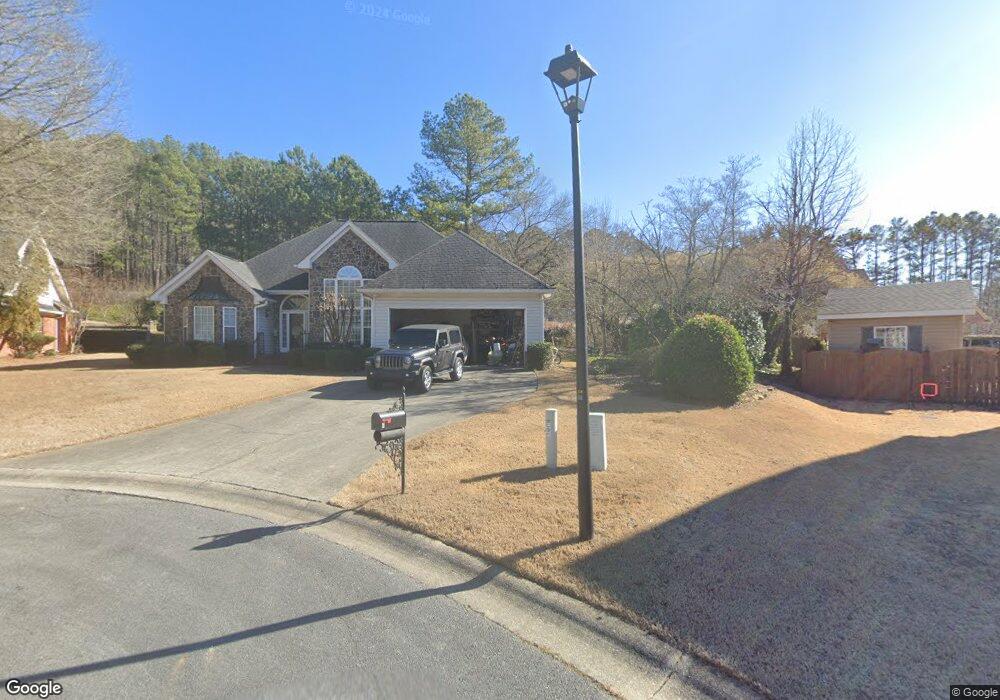
This home is located at 6 Preakness Ct SE, Rome, GA 30161 and is currently estimated at $398,460, approximately $182 per square foot. 6 Preakness Ct SE is a home located in Floyd County with nearby schools including Rome High School, Montessori School of Rome, and St. Mary School.
Ownership History
Date
Name
Owned For
Owner Type
Purchase Details
Closed on
Feb 22, 2012
Sold by
Morris James L
Bought by
Spence David C
Current Estimated Value
Purchase Details
Closed on
Oct 14, 2004
Sold by
Hamilton Deforest A and Hamilton Nancy T
Bought by
Roebuck Floyd F and Roebuck Ann B
Purchase Details
Closed on
Nov 4, 1996
Sold by
Pacific International Construction Inc
Bought by
Hamilton Deforest A and Hamil Nancy T
Purchase Details
Closed on
Oct 18, 1995
Sold by
Friis Patricia M and Warner Neil G
Bought by
Pacific International Construction Inc
Purchase Details
Closed on
Sep 9, 1994
Sold by
Southeastern Mills Inc
Bought by
Friis Patricia M and Warner Neil G
Purchase Details
Closed on
Jul 1, 1993
Sold by
Dupre William A
Bought by
Southeastern Mills Inc
Purchase Details
Closed on
Dec 26, 1989
Bought by
Hardy Realty & Development
Create a Home Valuation Report for This Property
The Home Valuation Report is an in-depth analysis detailing your home's value as well as a comparison with similar homes in the area
Home Values in the Area
Average Home Value in this Area
Purchase History
| Date | Buyer | Sale Price | Title Company |
|---|---|---|---|
| Spence David C | -- | -- | |
| Roebuck Floyd F | $214,900 | -- | |
| Hamilton Deforest A | $184,500 | -- | |
| Pacific International Construction Inc | $19,500 | -- | |
| Friis Patricia M | $339,500 | -- | |
| Southeastern Mills Inc | $440,000 | -- | |
| Dupre William A | $440,000 | -- | |
| Hardy Realty & Development | -- | -- |
Source: Public Records
Tax History Compared to Growth
Tax History
| Year | Tax Paid | Tax Assessment Tax Assessment Total Assessment is a certain percentage of the fair market value that is determined by local assessors to be the total taxable value of land and additions on the property. | Land | Improvement |
|---|---|---|---|---|
| 2024 | $3,044 | $141,668 | $14,323 | $127,345 |
| 2023 | $3,021 | $136,372 | $12,766 | $123,606 |
| 2022 | $2,633 | $113,836 | $10,586 | $103,250 |
| 2021 | $2,350 | $95,084 | $9,652 | $85,432 |
| 2020 | $2,262 | $88,823 | $7,473 | $81,350 |
| 2019 | $2,162 | $84,648 | $7,473 | $77,175 |
| 2018 | $1,827 | $69,490 | $7,473 | $62,017 |
| 2017 | $1,717 | $66,521 | $7,473 | $59,048 |
| 2016 | $1,681 | $65,360 | $7,440 | $57,920 |
| 2015 | $1,605 | $67,204 | $7,440 | $59,764 |
| 2014 | $1,605 | $67,204 | $7,440 | $59,764 |
Source: Public Records
Map
Nearby Homes
- 211 Chateau Dr SE
- 15 Saddlebrook Dr SE
- 3 Belmont Ct SE
- 22 Coventry Dr SE
- 20 Coventry Dr SE
- 35 Cumberland Dr SE
- 36 Coventry Dr SE
- 38 Coventry Dr SE
- 18 Wellington Way SE
- 14 Wellington Way SE
- 2107 Rockmart Rd SE
- 119 Chateau Dr SE
- 113 Chateau Dr SE
- 211 Alfred Ave SE
- 115 Hawthorne St SE
- 519 Dr SE
- 212 Alfred Ave SE
- 5 Derby Ct SE
- 5 Derby NE
- 7 Preakness Ct SE
- 4 Preakness Ct SE
- 3 Derby Ct SE
- 0 Preakness Ct SE Unit 7602161
- 0 Preakness Ct SE Unit 9015718
- 0 Preakness Ct SE Unit 3042913
- 205 Chateau Dr SE
- 6 Derby Ct SE
- 5 Preakness Ct SE
- 5 Preakness Ct SE
- 18 Saddlebrook Dr SE
- 16 Saddlebrook Dr SE
- 207 Chateau Dr SE
- 3 Preakness Ct SE Unit 17
- 3 Preakness Ct SE
- 0 Derby Ct SE Unit 7384150
- 0 Derby Ct SE Unit 3279494
- 0 Derby Ct SE