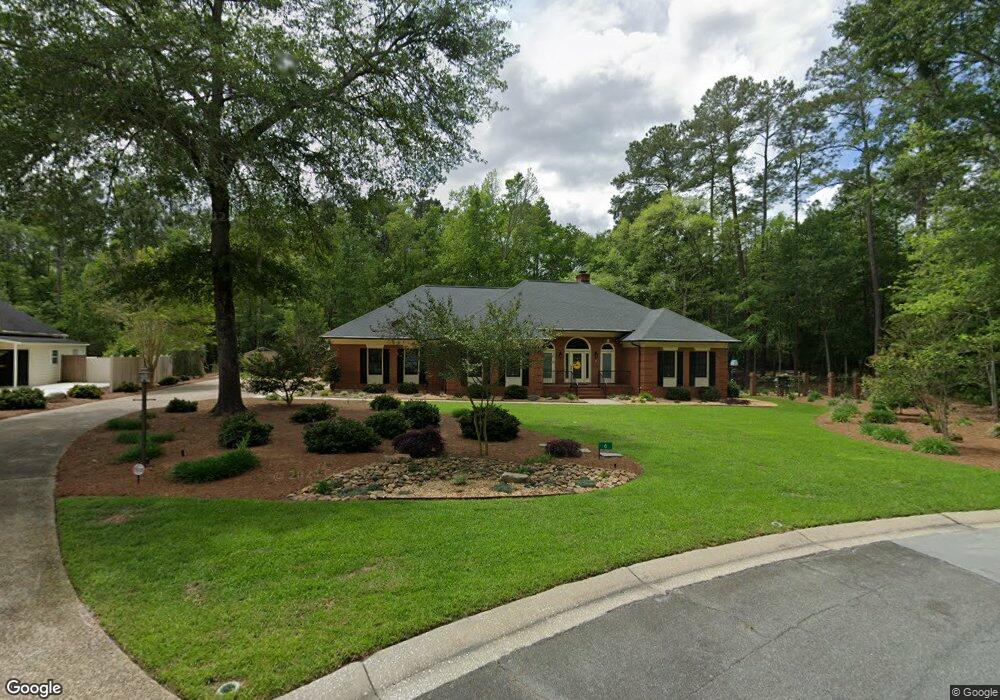
6 Quail Run Moultrie, GA 31768
Estimated Value: $434,968 - $623,000
--
Bed
4
Baths
2,826
Sq Ft
$185/Sq Ft
Est. Value
About This Home
This home is located at 6 Quail Run, Moultrie, GA 31768 and is currently estimated at $521,492, approximately $184 per square foot. 6 Quail Run is a home located in Colquitt County with nearby schools including Wright Elementary School, Willie J. Williams Middle School, and C.A. Gray Junior High School.
Ownership History
Date
Name
Owned For
Owner Type
Purchase Details
Closed on
Jul 3, 2012
Sold by
Weber Stephen W
Bought by
Cindy Stephen and Cindy Weber Liv
Current Estimated Value
Purchase Details
Closed on
Aug 15, 2010
Sold by
Bryant Leo C
Bought by
Weber Stephen W and Weber Cindy E
Purchase Details
Closed on
Nov 22, 2006
Sold by
Ormon Todd C
Bought by
Bryant Leo C
Home Financials for this Owner
Home Financials are based on the most recent Mortgage that was taken out on this home.
Original Mortgage
$269,600
Interest Rate
5.88%
Mortgage Type
New Conventional
Purchase Details
Closed on
Dec 16, 2004
Sold by
Reese Zetra W
Bought by
Ormon Todd C
Purchase Details
Closed on
Oct 26, 1999
Sold by
Reese Norman O
Bought by
Reese Zetra W
Purchase Details
Closed on
Jul 26, 1999
Bought by
Reese Norman O
Purchase Details
Closed on
Nov 27, 1996
Bought by
Davis Frank E
Purchase Details
Closed on
Jul 19, 1991
Bought by
Boley Gary W
Create a Home Valuation Report for This Property
The Home Valuation Report is an in-depth analysis detailing your home's value as well as a comparison with similar homes in the area
Home Values in the Area
Average Home Value in this Area
Purchase History
| Date | Buyer | Sale Price | Title Company |
|---|---|---|---|
| Cindy Stephen | $345,000 | -- | |
| Weber Stephen W | $345,000 | -- | |
| Bryant Leo C | -- | -- | |
| Ormon Todd C | $295,000 | -- | |
| Reese Zetra W | -- | -- | |
| Reese Norman O | $243,000 | -- | |
| Davis Frank E | $191,500 | -- | |
| Boley Gary W | $23,000 | -- |
Source: Public Records
Mortgage History
| Date | Status | Borrower | Loan Amount |
|---|---|---|---|
| Previous Owner | Bryant Leo C | $269,600 |
Source: Public Records
Tax History Compared to Growth
Tax History
| Year | Tax Paid | Tax Assessment Tax Assessment Total Assessment is a certain percentage of the fair market value that is determined by local assessors to be the total taxable value of land and additions on the property. | Land | Improvement |
|---|---|---|---|---|
| 2024 | $1,091 | $162,069 | $22,000 | $140,069 |
| 2023 | $1,360 | $187,310 | $20,000 | $167,310 |
| 2022 | $2,377 | $172,762 | $20,000 | $152,762 |
| 2021 | $2,089 | $162,493 | $20,000 | $142,493 |
| 2020 | $2,487 | $162,493 | $20,000 | $142,493 |
| 2019 | $1,748 | $130,682 | $20,000 | $110,682 |
| 2018 | $5,219 | $130,682 | $20,000 | $110,682 |
| 2017 | $2,050 | $130,682 | $20,000 | $110,682 |
| 2016 | $2,273 | $130,682 | $20,000 | $110,682 |
| 2015 | $2,411 | $130,682 | $20,000 | $110,682 |
| 2014 | $2,589 | $130,682 | $20,000 | $110,682 |
| 2013 | -- | $130,682 | $20,000 | $110,682 |
Source: Public Records
Map
Nearby Homes
- 0 Georgia 33
- 1941 S Main St
- 2021 S Main St
- 0 Gatewood Cir Unit 1652303
- 39 Hummingbird Rd
- 1712 Villa Dr SW
- 204 Nandina Dr
- Lot 3 Hummingbird Ln
- 1777 S Main St
- 1935 4th St SE
- 905 Barbara Cir
- 10 Hummingbird Rd
- 1904 5th St SE
- 1546 Ivy Ln
- 904 Barbara Cir
- 5 Bracken Dr
- 29 17th Ave SE
- 304 Tallokas Rd
- 304 Clubview Dr
- 305 Clubview Dr