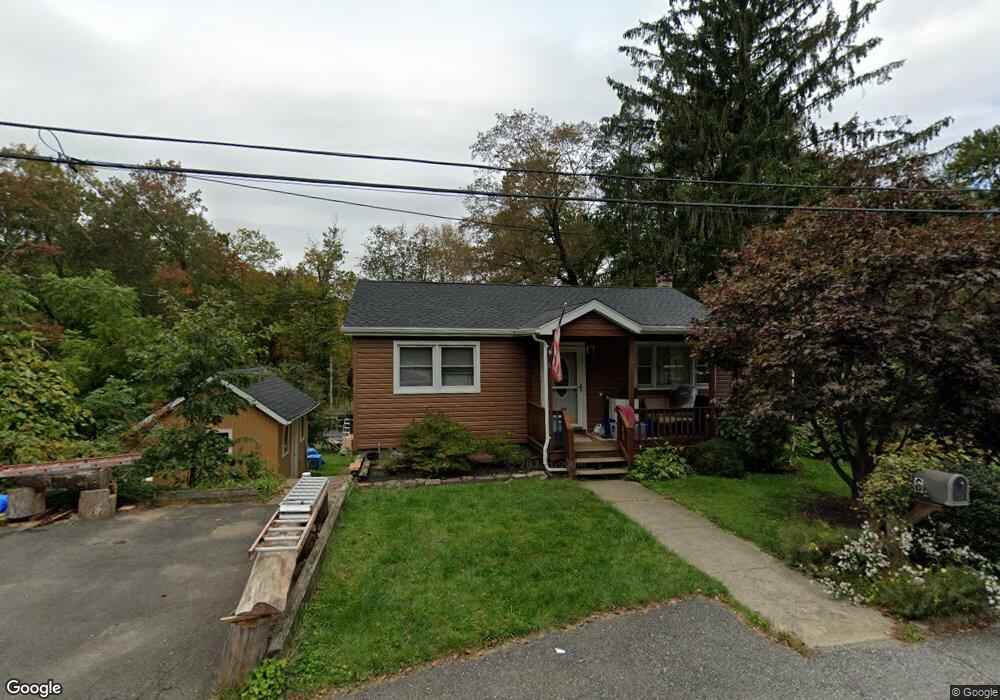
6 Quincy Rd Patterson, NY 12563
Estimated Value: $337,000 - $449,000
2
Beds
2
Baths
1,468
Sq Ft
$273/Sq Ft
Est. Value
About This Home
This home is located at 6 Quincy Rd, Patterson, NY 12563 and is currently estimated at $400,513, approximately $272 per square foot. 6 Quincy Rd is a home located in Putnam County with nearby schools including Brewster High School, C.V. Starr Intermediate School, and John F. Kennedy Elementary School.
Ownership History
Date
Name
Owned For
Owner Type
Purchase Details
Closed on
Jul 7, 2025
Sold by
Wall Meaghan R and Slater Frederick R
Bought by
Slater Frederick R and Slater Meaghan R
Current Estimated Value
Home Financials for this Owner
Home Financials are based on the most recent Mortgage that was taken out on this home.
Original Mortgage
$268,000
Outstanding Balance
$266,157
Interest Rate
6.03%
Mortgage Type
New Conventional
Estimated Equity
$134,356
Create a Home Valuation Report for This Property
The Home Valuation Report is an in-depth analysis detailing your home's value as well as a comparison with similar homes in the area
Home Values in the Area
Average Home Value in this Area
Purchase History
| Date | Buyer | Sale Price | Title Company |
|---|---|---|---|
| Slater Frederick R | -- | None Listed On Document | |
| Slater Frederick R | -- | None Listed On Document |
Source: Public Records
Mortgage History
| Date | Status | Borrower | Loan Amount |
|---|---|---|---|
| Open | Slater Frederick R | $268,000 | |
| Closed | Slater Frederick R | $268,000 |
Source: Public Records
Tax History
| Year | Tax Paid | Tax Assessment Tax Assessment Total Assessment is a certain percentage of the fair market value that is determined by local assessors to be the total taxable value of land and additions on the property. | Land | Improvement |
|---|---|---|---|---|
| 2024 | $9,705 | $321,000 | $44,300 | $276,700 |
| 2023 | $9,705 | $302,800 | $41,800 | $261,000 |
| 2022 | $8,548 | $241,600 | $34,000 | $207,600 |
| 2021 | $8,396 | $223,700 | $34,000 | $189,700 |
| 2020 | $4,971 | $217,200 | $34,000 | $183,200 |
| 2019 | $2,899 | $212,900 | $34,000 | $178,900 |
| 2018 | $4,764 | $207,700 | $31,900 | $175,800 |
| 2017 | $5,635 | $202,000 | $26,200 | $175,800 |
| 2016 | $5,336 | $200,000 | $26,200 | $173,800 |
| 2015 | -- | $230,400 | $26,200 | $204,200 |
| 2014 | -- | $230,400 | $26,200 | $204,200 |
Source: Public Records
Map
Nearby Homes