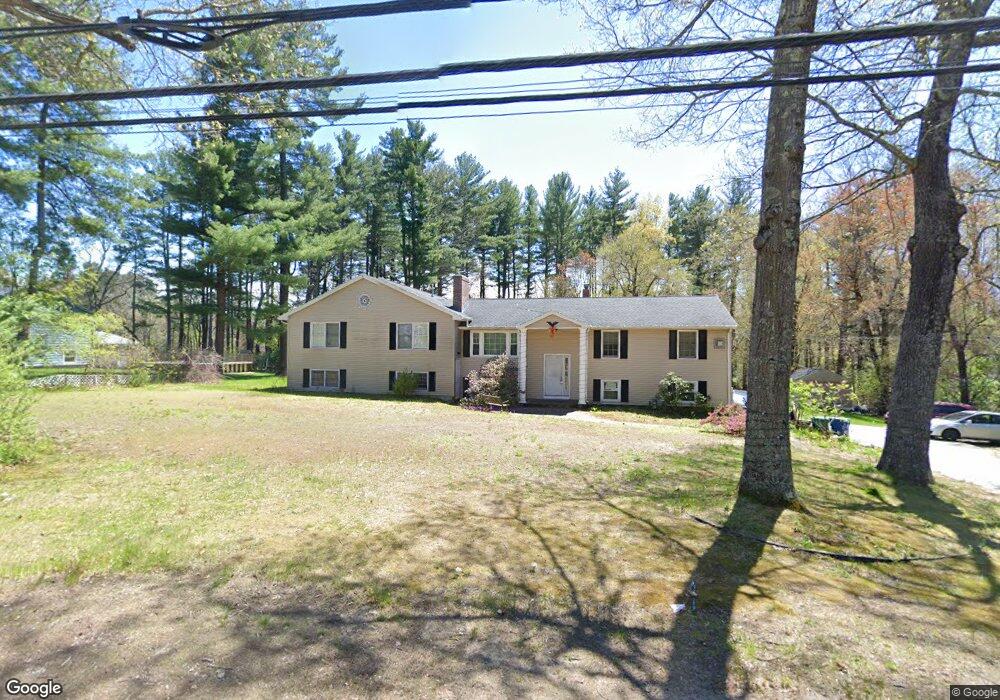
6 Ranlett Ln Billerica, MA 01821
Estimated Value: $992,979 - $1,111,000
5
Beds
4
Baths
3,723
Sq Ft
$285/Sq Ft
Est. Value
About This Home
This home is located at 6 Ranlett Ln, Billerica, MA 01821 and is currently estimated at $1,060,245, approximately $284 per square foot. 6 Ranlett Ln is a home located in Middlesex County with nearby schools including Billerica Memorial High School and Knowledge Beginnings South.
Ownership History
Date
Name
Owned For
Owner Type
Purchase Details
Closed on
May 9, 2006
Sold by
Donahue Mark and Luciano Patricia
Bought by
Dalton Virginia A
Current Estimated Value
Home Financials for this Owner
Home Financials are based on the most recent Mortgage that was taken out on this home.
Original Mortgage
$221,200
Interest Rate
6.34%
Mortgage Type
Purchase Money Mortgage
Purchase Details
Closed on
May 30, 2002
Sold by
Samman Maher
Bought by
Donahue Mark and Luciano Patricia
Home Financials for this Owner
Home Financials are based on the most recent Mortgage that was taken out on this home.
Original Mortgage
$310,000
Interest Rate
7%
Mortgage Type
Purchase Money Mortgage
Purchase Details
Closed on
May 30, 1997
Sold by
Chiu Tzay Jye and Chiu Yu Hsi
Bought by
Samman Maher
Purchase Details
Closed on
Apr 26, 1988
Sold by
Dietsch Carl E
Bought by
Chiu Tazy Iye
Create a Home Valuation Report for This Property
The Home Valuation Report is an in-depth analysis detailing your home's value as well as a comparison with similar homes in the area
Home Values in the Area
Average Home Value in this Area
Purchase History
| Date | Buyer | Sale Price | Title Company |
|---|---|---|---|
| Dalton Virginia A | $562,000 | -- | |
| Donahue Mark | $439,900 | -- | |
| Samman Maher | $175,000 | -- | |
| Chiu Tazy Iye | $187,900 | -- |
Source: Public Records
Mortgage History
| Date | Status | Borrower | Loan Amount |
|---|---|---|---|
| Open | Chiu Tazy Iye | $213,500 | |
| Closed | Dalton Virginia A | $221,200 | |
| Previous Owner | Chiu Tazy Iye | $310,000 | |
| Previous Owner | Chiu Tazy Iye | $272,000 |
Source: Public Records
Tax History Compared to Growth
Tax History
| Year | Tax Paid | Tax Assessment Tax Assessment Total Assessment is a certain percentage of the fair market value that is determined by local assessors to be the total taxable value of land and additions on the property. | Land | Improvement |
|---|---|---|---|---|
| 2025 | $9,936 | $873,900 | $330,800 | $543,100 |
| 2024 | $8,952 | $792,900 | $320,300 | $472,600 |
| 2023 | $8,860 | $746,400 | $291,500 | $454,900 |
| 2022 | $8,141 | $644,100 | $249,100 | $395,000 |
| 2021 | $7,814 | $601,100 | $218,700 | $382,400 |
| 2020 | $7,698 | $592,600 | $210,200 | $382,400 |
| 2019 | $7,314 | $542,600 | $210,200 | $332,400 |
| 2018 | $6,966 | $490,900 | $186,800 | $304,100 |
| 2017 | $6,490 | $460,600 | $184,900 | $275,700 |
| 2016 | $6,452 | $456,300 | $180,600 | $275,700 |
| 2015 | $6,329 | $450,800 | $175,100 | $275,700 |
| 2014 | $6,431 | $450,000 | $169,700 | $280,300 |
Source: Public Records
Map
Nearby Homes