Estimated Value: $263,242 - $333,000
--
Bed
--
Bath
1,977
Sq Ft
$156/Sq Ft
Est. Value
About This Home
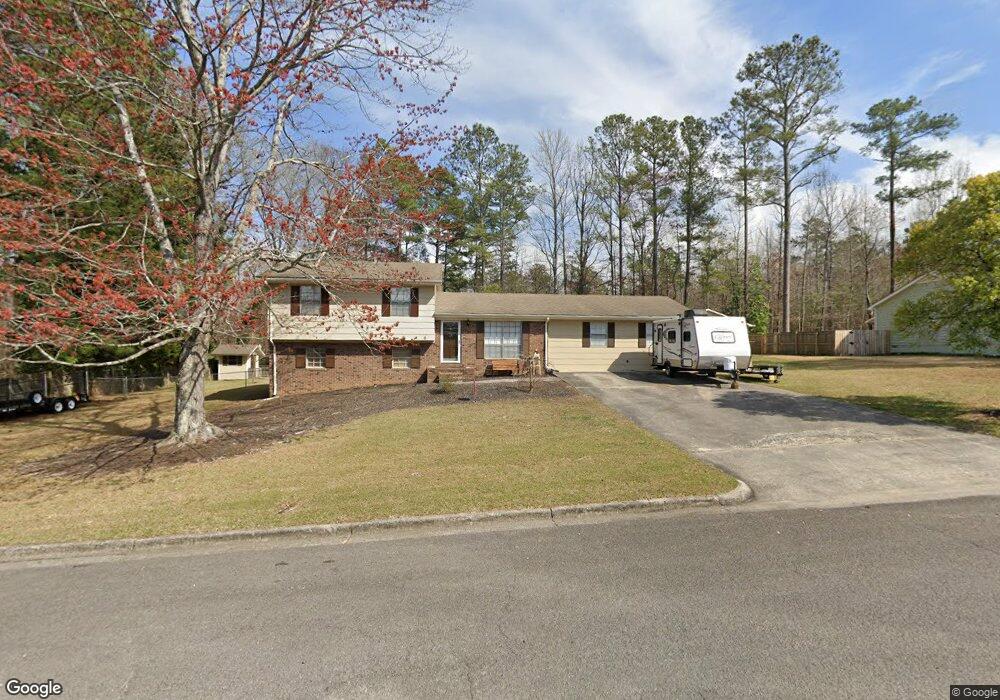
This home is located at 6 Rasbeary Rd SW, Rome, GA 30165 and is currently estimated at $307,561, approximately $155 per square foot. 6 Rasbeary Rd SW is a home located in Floyd County with nearby schools including Rome High School.
Ownership History
Date
Name
Owned For
Owner Type
Purchase Details
Closed on
Dec 11, 2014
Sold by
P and R
Bought by
P and R
Current Estimated Value
Purchase Details
Closed on
Mar 9, 1995
Bought by
P and R
Purchase Details
Closed on
Sep 25, 1980
Sold by
Holder Teddy Randall and Deborah Lynn
Bought by
Paul Raymond L
Purchase Details
Closed on
Feb 15, 1980
Sold by
Johnston Roger M and Johnston Glorene
Bought by
Holder Teddy Randall and Deborah Lynn
Purchase Details
Closed on
Nov 9, 1972
Sold by
Hudson Jack D and Hudson Mary V
Bought by
Johnston Roger M and Johnston Glorene
Purchase Details
Closed on
Oct 25, 1971
Sold by
Modern Maid Homes Inc
Bought by
Hudson Jack D and Hudson Mary V
Purchase Details
Closed on
Feb 22, 1971
Bought by
Modern Maid Homes Inc
Create a Home Valuation Report for This Property
The Home Valuation Report is an in-depth analysis detailing your home's value as well as a comparison with similar homes in the area
Home Values in the Area
Average Home Value in this Area
Purchase History
| Date | Buyer | Sale Price | Title Company |
|---|---|---|---|
| P | -- | -- | |
| P | -- | -- | |
| Paul Raymond L | $42,500 | -- | |
| Holder Teddy Randall | $38,500 | -- | |
| Johnston Roger M | $29,300 | -- | |
| Hudson Jack D | -- | -- | |
| Modern Maid Homes Inc | $26,500 | -- |
Source: Public Records
Tax History Compared to Growth
Tax History
| Year | Tax Paid | Tax Assessment Tax Assessment Total Assessment is a certain percentage of the fair market value that is determined by local assessors to be the total taxable value of land and additions on the property. | Land | Improvement |
|---|---|---|---|---|
| 2024 | $1,963 | $103,150 | $11,059 | $92,091 |
| 2023 | $2,344 | $88,247 | $9,953 | $78,294 |
| 2022 | $2,200 | $75,280 | $8,294 | $66,986 |
| 2021 | $2,093 | $68,604 | $8,294 | $60,310 |
| 2020 | $1,941 | $59,096 | $6,359 | $52,737 |
| 2019 | $1,886 | $56,911 | $6,359 | $50,552 |
| 2018 | $1,846 | $54,640 | $6,359 | $48,281 |
| 2017 | $1,775 | $50,513 | $6,359 | $44,154 |
| 2016 | $1,697 | $46,992 | $6,320 | $40,672 |
| 2015 | $1,609 | $47,592 | $6,320 | $41,272 |
| 2014 | $1,609 | $47,592 | $6,320 | $41,272 |
Source: Public Records
Map
Nearby Homes
- 12 Lucas Ln SW
- 27 Stonebrook Dr SW
- 37 Mountain Chase Rd SW
- 2 Stonebrook Dr SW
- 14 Limon Place SW
- 16 Brandon Ln
- 31 Bentley Ln
- 31 Bentley Ln SW
- 329 Leafmore Rd SW
- 99 Janie Beth Dr SW
- 0 Hidden Ridge Dr Unit 10343694
- 0 Hidden Ridge Dr Unit 10343706
- 0 Hidden Ridge Dr Unit 10343701
- 0 Hidden Ridge Dr Unit 10343693
- 0 Hidden Ridge Dr Unit 10343685
- 0 Hidden Ridge Dr Unit 10556470
- 0 Hidden Ridge Dr Unit 10343688
- 0 Hidden Ridge Dr Unit 10343680
- 0 Hidden Ridge Dr Unit 10343696
- 0 Hidden Ridge Dr Unit 10343689
- 8 Rasbeary Rd SW
- 4 Rasbeary Rd SW
- 3 Rasbeary Rd SW
- 2 Lucas Ln SW
- 10 Rasbeary Rd SW
- 10 Rasbeary Rd SW
- 2 Rasbeary Rd SW
- 1 Rasbeary Rd SW
- 3 Lucas Ln SW
- 1702 Wilkerson Rd SW
- 13 Rasbeary Rd SW
- 6 Lucas Ln SW
- 6 Lucas Ln SW
- 5 Lucas Ln SW
- 1704 Wilkerson Rd SW
- 5 Waterford Place SW
- 4 Waterford Place SW
- 15 Rasbeary Rd SW
- 1703 Wilkerson Rd SW
- 7 Lucas Ln SW