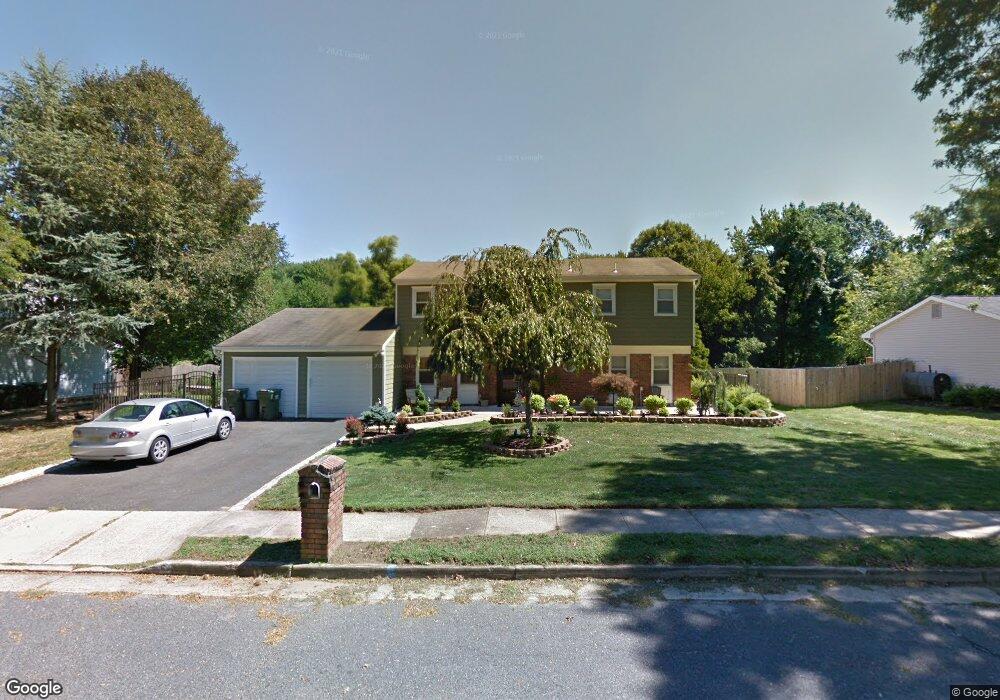
6 Rene Dr Marlboro, NJ 07746
Estimated Value: $847,151 - $1,000,000
4
Beds
3
Baths
2,676
Sq Ft
$342/Sq Ft
Est. Value
About This Home
This home is located at 6 Rene Dr, Marlboro, NJ 07746 and is currently estimated at $914,788, approximately $341 per square foot. 6 Rene Dr is a home located in Monmouth County with nearby schools including Asher Holmes Elementary School, Marlboro Middle School, and Marlboro High School.
Ownership History
Date
Name
Owned For
Owner Type
Purchase Details
Closed on
Jan 26, 2010
Sold by
Hsbc Bank Usa National Association
Bought by
Bickford Scott and Bickford Angela
Current Estimated Value
Home Financials for this Owner
Home Financials are based on the most recent Mortgage that was taken out on this home.
Original Mortgage
$336,000
Outstanding Balance
$223,264
Interest Rate
5.11%
Mortgage Type
New Conventional
Estimated Equity
$691,524
Purchase Details
Closed on
Aug 4, 2009
Sold by
Hilary Joyce and Steinberg Joyce Pearlman
Bought by
Hsbc Bank Usa National Association
Create a Home Valuation Report for This Property
The Home Valuation Report is an in-depth analysis detailing your home's value as well as a comparison with similar homes in the area
Home Values in the Area
Average Home Value in this Area
Purchase History
| Date | Buyer | Sale Price | Title Company |
|---|---|---|---|
| Bickford Scott | $420,000 | Multiple | |
| Hsbc Bank Usa National Association | -- | Multiple |
Source: Public Records
Mortgage History
| Date | Status | Borrower | Loan Amount |
|---|---|---|---|
| Open | Bickford Scott | $336,000 |
Source: Public Records
Tax History Compared to Growth
Tax History
| Year | Tax Paid | Tax Assessment Tax Assessment Total Assessment is a certain percentage of the fair market value that is determined by local assessors to be the total taxable value of land and additions on the property. | Land | Improvement |
|---|---|---|---|---|
| 2025 | $10,602 | $425,100 | $193,600 | $231,500 |
| 2024 | $10,134 | $425,100 | $193,600 | $231,500 |
| 2023 | $10,134 | $425,100 | $193,600 | $231,500 |
| 2022 | $9,875 | $425,100 | $193,600 | $231,500 |
| 2021 | $9,777 | $425,100 | $193,600 | $231,500 |
| 2020 | $9,773 | $425,100 | $193,600 | $231,500 |
| 2019 | $9,777 | $425,100 | $193,600 | $231,500 |
| 2018 | $9,612 | $425,100 | $193,600 | $231,500 |
| 2017 | $9,424 | $425,100 | $193,600 | $231,500 |
| 2016 | $9,386 | $425,100 | $193,600 | $231,500 |
| 2015 | $9,257 | $425,600 | $193,600 | $232,000 |
| 2014 | $9,157 | $416,600 | $193,600 | $223,000 |
Source: Public Records
Map
Nearby Homes