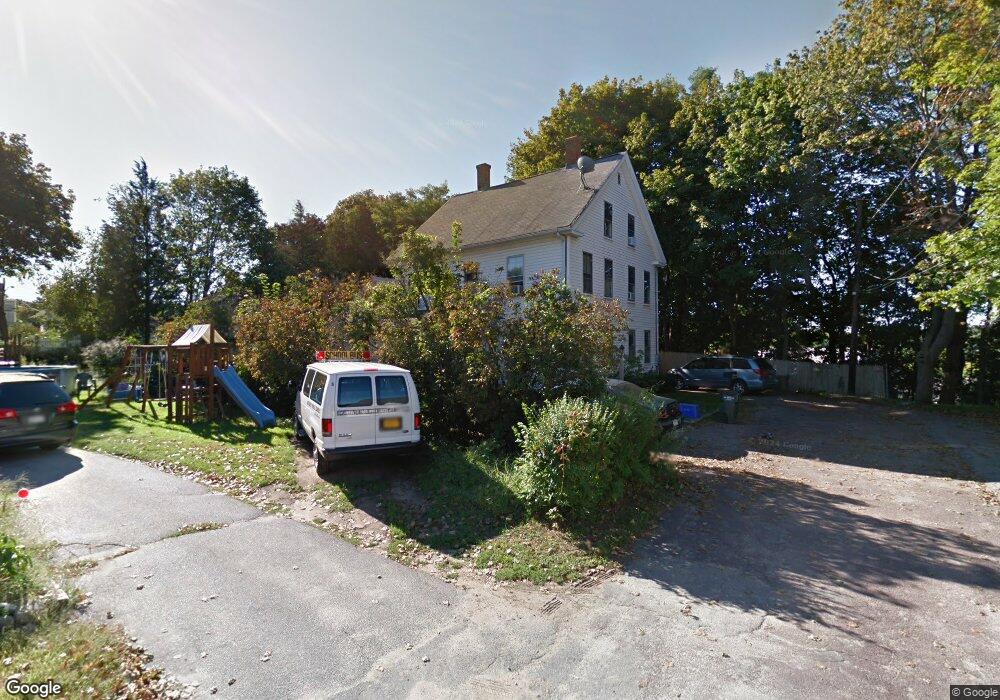
6 Richs Ct Amesbury, MA 01913
Estimated Value: $628,000 - $691,000
6
Beds
2
Baths
2,104
Sq Ft
$314/Sq Ft
Est. Value
About This Home
This home is located at 6 Richs Ct, Amesbury, MA 01913 and is currently estimated at $661,183, approximately $314 per square foot. 6 Richs Ct is a home located in Essex County with nearby schools including Amesbury High School and Amesbury Seventh-Day Adventist School.
Ownership History
Date
Name
Owned For
Owner Type
Purchase Details
Closed on
Apr 16, 2021
Sold by
Ehlers Pia C and Ehlers Shelley R
Bought by
Smith Christian P and Smith Maryjane
Current Estimated Value
Home Financials for this Owner
Home Financials are based on the most recent Mortgage that was taken out on this home.
Original Mortgage
$309,600
Outstanding Balance
$279,531
Interest Rate
3%
Mortgage Type
Purchase Money Mortgage
Estimated Equity
$381,652
Create a Home Valuation Report for This Property
The Home Valuation Report is an in-depth analysis detailing your home's value as well as a comparison with similar homes in the area
Home Values in the Area
Average Home Value in this Area
Purchase History
| Date | Buyer | Sale Price | Title Company |
|---|---|---|---|
| Smith Christian P | $387,600 | None Available |
Source: Public Records
Mortgage History
| Date | Status | Borrower | Loan Amount |
|---|---|---|---|
| Open | Smith Christian P | $309,600 |
Source: Public Records
Tax History
| Year | Tax Paid | Tax Assessment Tax Assessment Total Assessment is a certain percentage of the fair market value that is determined by local assessors to be the total taxable value of land and additions on the property. | Land | Improvement |
|---|---|---|---|---|
| 2025 | $7,203 | $470,800 | $158,800 | $312,000 |
| 2024 | $7,407 | $473,600 | $177,800 | $295,800 |
| 2023 | $7,360 | $450,400 | $154,600 | $295,800 |
| 2022 | $6,751 | $381,600 | $134,500 | $247,100 |
| 2021 | $6,902 | $378,200 | $98,400 | $279,800 |
| 2020 | $6,369 | $370,700 | $94,600 | $276,100 |
| 2019 | $5,188 | $282,400 | $94,600 | $187,800 |
| 2018 | $5,137 | $270,500 | $90,100 | $180,400 |
| 2017 | $4,698 | $235,500 | $90,100 | $145,400 |
| 2016 | $4,184 | $206,300 | $70,100 | $136,200 |
| 2015 | $4,237 | $206,300 | $70,100 | $136,200 |
| 2014 | $4,326 | $206,300 | $70,100 | $136,200 |
Source: Public Records
Map
Nearby Homes
- 4 Boardman St
- 25 Cedar St Unit 4
- 10 Congress St Unit 301
- 10 Congress St Unit 302
- 21 Congress St
- 101 Market St Unit B
- 40 Congress St
- 8 Winter St
- 27 Lake St
- 5 Russell St Unit 1
- 2 Perkins St
- 81 High St Unit 23
- 49 Orchard St
- 20 Lincoln Ct
- 48 Orchard St
- 149 Market St
- 4 Larnard Ct
- 4 Greenwood St
- 64 Whitehall Rd
- 15 Wells Ave
- 6 Richs Ct
- 4 Richs Ct
- 7 Richs Ct
- 11 Washington St
- 7 Rich's Ct
- 5 Richs Ct Unit 1
- 5 Richs Ct Unit 2
- 5 Richs Ct
- 5 Richs Ct Unit 5C
- 13 Washington St
- 9 Washington St
- 102 Elm St
- 104 Elm St
- 104 Elm St Unit 104 Elm St. Unit A
- 7 Washington St
- 98 Elm St
- 5 Washington St
- 72 Elm St
- 94 Elm St Unit B
- 94 Elm St Unit A
Your Personal Tour Guide
Ask me questions while you tour the home.