
Seller's Agent in 2026
Jacob Smith
Ward Wight Sotheby's International Realty
(732) 567-0162
2 in this area
120 Total Sales

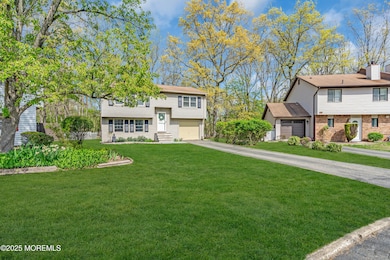
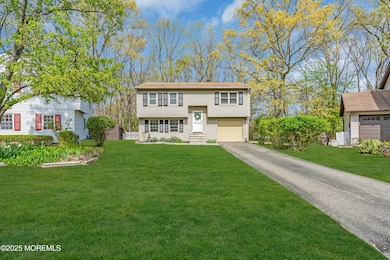
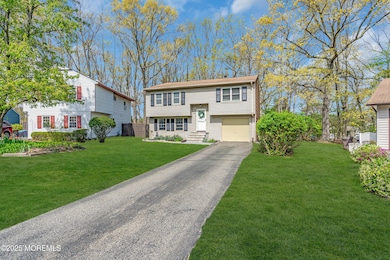
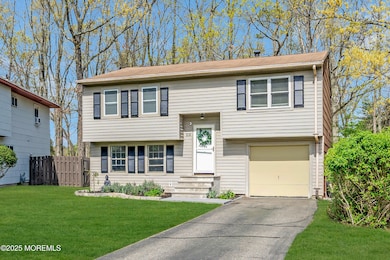
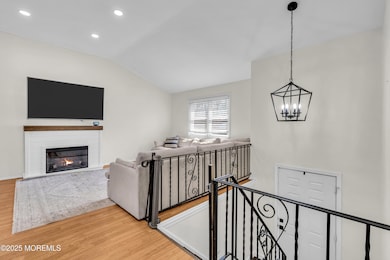
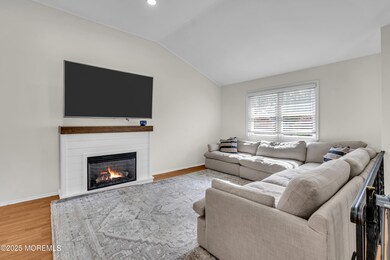
Don't miss this rare opportunity to own a detached bi-level home in the desirable Windmill Club Condo community of Howell! This 3-bedroom, 1.5-bath home offers the space and privacy of a single-family home with the convenience of condo living. Features include vaulted ceilings, recessed lighting, central A/C, updated baths, an attached garage, and a laundry room. Enjoy outdoor living with a private patio and a generous yard lined with evergreen bushes. Association provides lawn maintenance, a clubhouse with spacious community room that can be reserved for parties, and an attractive in-ground swimming pool with scenic view of lake & lifeguard. All this in a well-maintained community with amenities and low-maintenance ownership!
Last Agent to Sell the Property
Ward Wight Sotheby's International Realty License #0560385 Listed on: 12/15/2025
| Date | Type | Sale Price | Title Company |
|---|---|---|---|
| Deed | $450,000 | Worldwide Title (Recording Ser | |
| Bargain Sale Deed | $330,000 | Old Republic Title | |
| Bargain Sale Deed | $330,000 | Old Republic Title |
| Date | Status | Loan Amount | Loan Type |
|---|---|---|---|
| Open | $441,849 | FHA | |
| Previous Owner | $305,250 | FHA |
| Date | Event | Price | List to Sale | Price per Sq Ft |
|---|---|---|---|---|
| 01/30/2026 01/30/26 | Sold | $450,000 | +0.2% | $285 / Sq Ft |
| 01/07/2026 01/07/26 | Pending | -- | -- | -- |
| 12/15/2025 12/15/25 | For Sale | $449,000 | -- | $284 / Sq Ft |
| Year | Tax Paid | Tax Assessment Tax Assessment Total Assessment is a certain percentage of the fair market value that is determined by local assessors to be the total taxable value of land and additions on the property. | Land | Improvement |
|---|---|---|---|---|
| 2025 | $6,419 | $340,700 | $220,000 | $120,700 |
| 2024 | $6,419 | $338,500 | $220,000 | $118,500 |
| 2023 | $6,419 | $344,900 | $200,200 | $144,700 |
| 2022 | $4,905 | $261,000 | $123,200 | $137,800 |
| 2021 | $4,905 | $238,000 | $115,500 | $122,500 |
| 2020 | $5,496 | $236,700 | $115,500 | $121,200 |
| 2019 | $5,025 | $212,400 | $93,300 | $119,100 |
| 2018 | $4,798 | $201,500 | $88,000 | $113,500 |
| 2017 | $4,505 | $187,100 | $77,000 | $110,100 |
| 2016 | $3,947 | $162,300 | $55,000 | $107,300 |
| 2015 | $3,436 | $150,000 | $45,500 | $104,500 |
| 2014 | $3,648 | $147,200 | $56,700 | $90,500 |
Seller's Agent in 2026
Jacob Smith
Ward Wight Sotheby's International Realty
(732) 567-0162
2 in this area
120 Total Sales
Buyer's Agent in 2026
Luke Graham
Reliable Realty LLC
(848) 333-8542
1 in this area
61 Total Sales
Source: MOREMLS (Monmouth Ocean Regional REALTORS®)
MLS Number: 22536333
APN: 21-00237-02-00006-0000-C1000
Disclaimer: Certain information contained herein is derived from information provided by parties other than Homes.com. All information provided is deemed reliable, but is not guaranteed to be accurate and should be independently verified.
![]() IDX information is provided exclusively for personal, non-commercial use, and may not be used for any purpose other than to identify prospective properties consumers may be interested in purchasing.
IDX information is provided exclusively for personal, non-commercial use, and may not be used for any purpose other than to identify prospective properties consumers may be interested in purchasing.
Information is deemed reliable but not guaranteed.
Ask me questions while you tour the home.