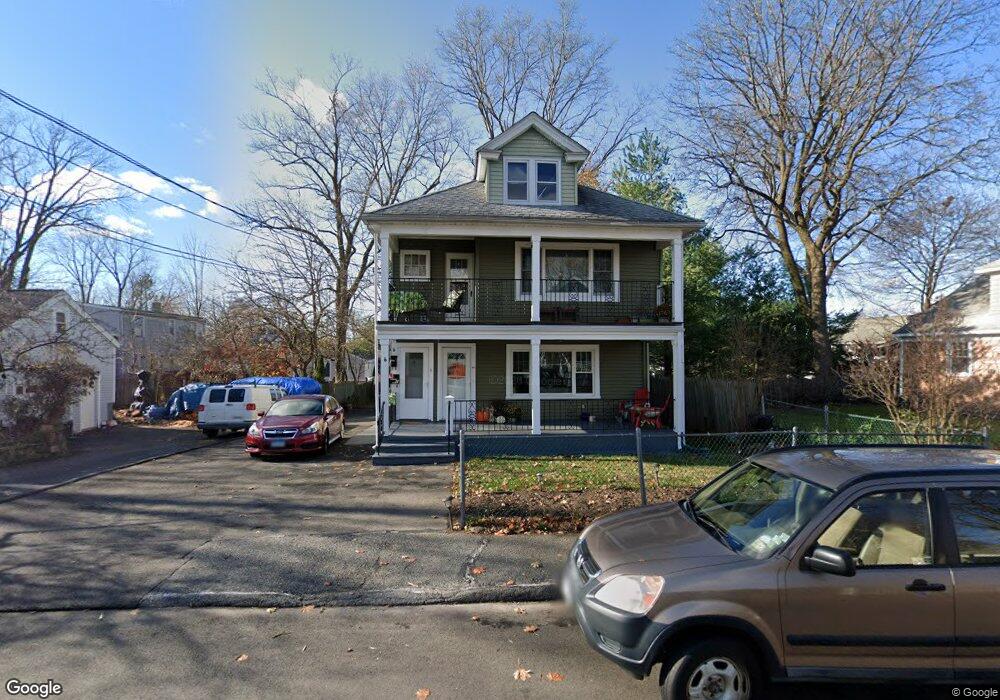
6 Roscoe St Norwalk, CT 06851
Wolfpit NeighborhoodEstimated Value: $729,000 - $811,000
3
Beds
2
Baths
2,170
Sq Ft
$350/Sq Ft
Est. Value
About This Home
This home is located at 6 Roscoe St, Norwalk, CT 06851 and is currently estimated at $760,486, approximately $350 per square foot. 6 Roscoe St is a home located in Fairfield County with nearby schools including Tracey School, West Rocks Middle School, and Norwalk High School.
Ownership History
Date
Name
Owned For
Owner Type
Purchase Details
Closed on
Feb 22, 2022
Sold by
Pertesis John G
Bought by
37 Jackson Drive Llc
Current Estimated Value
Home Financials for this Owner
Home Financials are based on the most recent Mortgage that was taken out on this home.
Original Mortgage
$447,000
Interest Rate
3.11%
Mortgage Type
Purchase Money Mortgage
Purchase Details
Closed on
Dec 30, 2021
Sold by
Kyriakides Elisavet
Bought by
Pertesis John G
Home Financials for this Owner
Home Financials are based on the most recent Mortgage that was taken out on this home.
Original Mortgage
$447,000
Interest Rate
3.11%
Mortgage Type
Purchase Money Mortgage
Purchase Details
Closed on
May 2, 1975
Bought by
Kyriakides Elisavet
Create a Home Valuation Report for This Property
The Home Valuation Report is an in-depth analysis detailing your home's value as well as a comparison with similar homes in the area
Home Values in the Area
Average Home Value in this Area
Purchase History
| Date | Buyer | Sale Price | Title Company |
|---|---|---|---|
| 37 Jackson Drive Llc | -- | None Available | |
| 37 Jackson Drive Llc | -- | None Available | |
| Pertesis John G | $596,950 | None Available | |
| Pertesis John G | $596,950 | None Available | |
| Kyriakides Elisavet | -- | -- |
Source: Public Records
Mortgage History
| Date | Status | Borrower | Loan Amount |
|---|---|---|---|
| Previous Owner | Pertesis John G | $447,000 | |
| Previous Owner | Kyriakides Elisavet | $70,000 | |
| Previous Owner | Kyriakides Elisavet | $12,000 | |
| Previous Owner | Kyriakides Elisavet | $52,902 | |
| Previous Owner | Kyriakides Elisavet | $80,833 |
Source: Public Records
Tax History Compared to Growth
Tax History
| Year | Tax Paid | Tax Assessment Tax Assessment Total Assessment is a certain percentage of the fair market value that is determined by local assessors to be the total taxable value of land and additions on the property. | Land | Improvement |
|---|---|---|---|---|
| 2025 | $10,806 | $452,140 | $170,350 | $281,790 |
| 2024 | $10,646 | $452,140 | $170,350 | $281,790 |
| 2023 | $8,594 | $342,600 | $138,140 | $204,460 |
| 2022 | $8,409 | $342,600 | $138,140 | $204,460 |
| 2021 | $9,173 | $342,600 | $138,140 | $204,460 |
| 2020 | $8,207 | $342,600 | $138,140 | $204,460 |
| 2019 | $7,988 | $342,600 | $138,140 | $204,460 |
| 2018 | $7,385 | $277,580 | $157,000 | $120,580 |
| 2017 | $7,129 | $277,580 | $157,000 | $120,580 |
| 2016 | $7,295 | $286,740 | $157,000 | $129,740 |
| 2015 | $7,042 | $277,580 | $157,000 | $120,580 |
| 2014 | $6,951 | $277,580 | $157,000 | $120,580 |
Source: Public Records
Map
Nearby Homes
- 15 Dry Hill Rd
- 12 Merrill Rd
- 44 Ambler Dr
- 24 Sawmill Rd
- 6 Plumley Cir
- 49 Barbara Dr
- 2 Clearview Ave
- 14 E Rocks Rd
- 9 Park St Unit 217
- 71 Saddle Rd
- 31 High St Unit 4-2B
- 16 Katy Ln
- 20 W Rocks Rd
- 77 Walter Ave
- 42 County St
- 162 Strawberry Hill Ave
- 1 Blue Mountain Ridge
- 360 Westport Ave Unit 1
- 65 Wolfpit Ave Unit 5C
- 4 Union Ave Unit 26
- 6 Roscoe St Unit 2
- 6 Roscoe St Unit 1
- 10 Harrison Ave
- 8 Harrison Ave
- 16 Nelson Ave
- 14 Nelson Ave
- 12 Nelson Ave
- 12 Nelson Ave Unit 1
- 5 Roscoe St
- 3 Roscoe St
- 7 Broadview Terrace
- 1 Roscoe St
- 9 Broadview Terrace
- 7 Roscoe St
- 11 Broadview Terrace
- 3 Broadview Terrace
- 18 Nelson Ave
- 1 Broadview Terrace
- 7 Harrison Ave
- 9 Harrison Ave