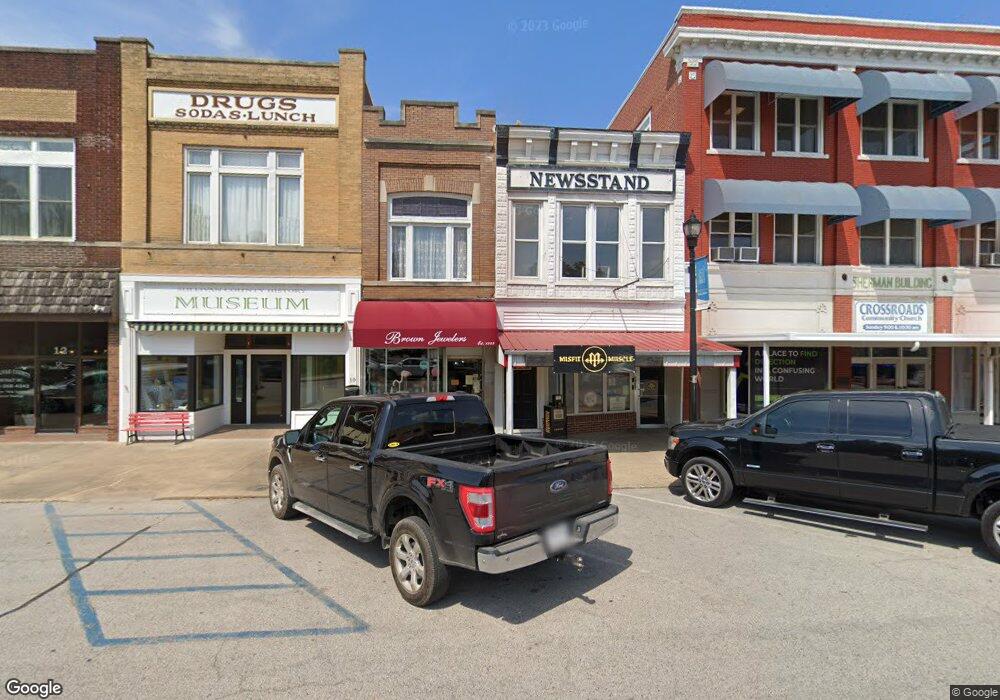
6 S Court St Sullivan, IN 47882
Estimated Value: $107,406
--
Bed
--
Bath
3,672
Sq Ft
$29/Sq Ft
Est. Value
About This Home
This home is located at 6 S Court St, Sullivan, IN 47882 and is currently estimated at $107,406, approximately $29 per square foot. 6 S Court St is a home located in Sullivan County with nearby schools including Sullivan High School.
Ownership History
Date
Name
Owned For
Owner Type
Purchase Details
Closed on
Feb 6, 2024
Sold by
Schurz Zachary K and Schurz Kendra
Bought by
Schurz Kendra
Current Estimated Value
Purchase Details
Closed on
Nov 9, 2022
Sold by
Sullivan Square Diner Inc
Bought by
Schurz Zachary and Schurz Kendra
Home Financials for this Owner
Home Financials are based on the most recent Mortgage that was taken out on this home.
Original Mortgage
$46,400
Interest Rate
6.36%
Mortgage Type
New Conventional
Purchase Details
Closed on
May 17, 2019
Sold by
Chenoweth Deborah K
Bought by
Sullivan Square Diner Inc
Purchase Details
Closed on
Oct 25, 2016
Sold by
Jewell Terrance L
Bought by
Chenoweth Deborah K and Jewell Deborah K
Purchase Details
Closed on
Dec 20, 2010
Sold by
Arthur Cara
Bought by
Jewell Terrance L and Jewell Deborah K
Purchase Details
Closed on
Mar 1, 2010
Sold by
Arthur Holdings Llc
Bought by
Arthur Cara
Create a Home Valuation Report for This Property
The Home Valuation Report is an in-depth analysis detailing your home's value as well as a comparison with similar homes in the area
Home Values in the Area
Average Home Value in this Area
Purchase History
| Date | Buyer | Sale Price | Title Company |
|---|---|---|---|
| Schurz Kendra | -- | None Listed On Document | |
| Schurz Zachary | -- | -- | |
| Sullivan Square Diner Inc | $65,000 | Sullivan County Abstract Inc | |
| Chenoweth Deborah K | -- | Attorney | |
| Jewell Terrance L | -- | -- | |
| Arthur Cara | -- | -- |
Source: Public Records
Mortgage History
| Date | Status | Borrower | Loan Amount |
|---|---|---|---|
| Previous Owner | Schurz Zachary | $46,400 |
Source: Public Records
Tax History Compared to Growth
Tax History
| Year | Tax Paid | Tax Assessment Tax Assessment Total Assessment is a certain percentage of the fair market value that is determined by local assessors to be the total taxable value of land and additions on the property. | Land | Improvement |
|---|---|---|---|---|
| 2024 | $1,827 | $54,900 | $6,100 | $48,800 |
| 2023 | $1,827 | $60,900 | $6,100 | $54,800 |
| 2022 | $1,641 | $54,700 | $4,700 | $50,000 |
| 2021 | $1,539 | $51,300 | $4,700 | $46,600 |
| 2020 | $1,539 | $51,300 | $4,700 | $46,600 |
| 2019 | $1,539 | $51,300 | $4,700 | $46,600 |
| 2018 | $1,539 | $51,300 | $4,700 | $46,600 |
| 2017 | $1,506 | $50,200 | $4,700 | $45,500 |
| 2016 | $1,506 | $50,200 | $4,700 | $45,500 |
| 2014 | $1,515 | $50,500 | $4,700 | $45,800 |
| 2013 | $1,515 | $50,500 | $4,700 | $45,800 |
Source: Public Records
Map
Nearby Homes
- 206 W Washington St
- 682 E Pr Rd 265 N
- 241 W Washington St
- 314 W Washington St
- 302 S Court St
- 301 S Section St
- 237 S Main St
- 403 W Sylvandell St
- 221 S State St
- 209 E Jackson St
- 245 S State St
- 319 E Wall St
- 321 E Wall St
- 325 E Wall St
- 323 E Wall St
- 324 S State St
- 917.5 N Section St
- 524 W Sylvandell St
- 312 E Washington St
- 314 E Washington St
- 14 S Court St
- 16 S Court St
- 106 W Washington St
- 19 S Section St
- 18 W Washington St
- 20 W Washington St
- 16 W Washington St
- 115 W Jackson St
- 103 S Section St
- 211 W Washington St
- 10 N Section St
- 117 W Jackson St Unit 117 Apt B
- 117 W Jackson St
- 29 W Jackson St
- 213 W Washington St
- 18 N Section St
- 4 N Main St
- 109 S Section St
- 218 W Jackson St
- 102 S Section St