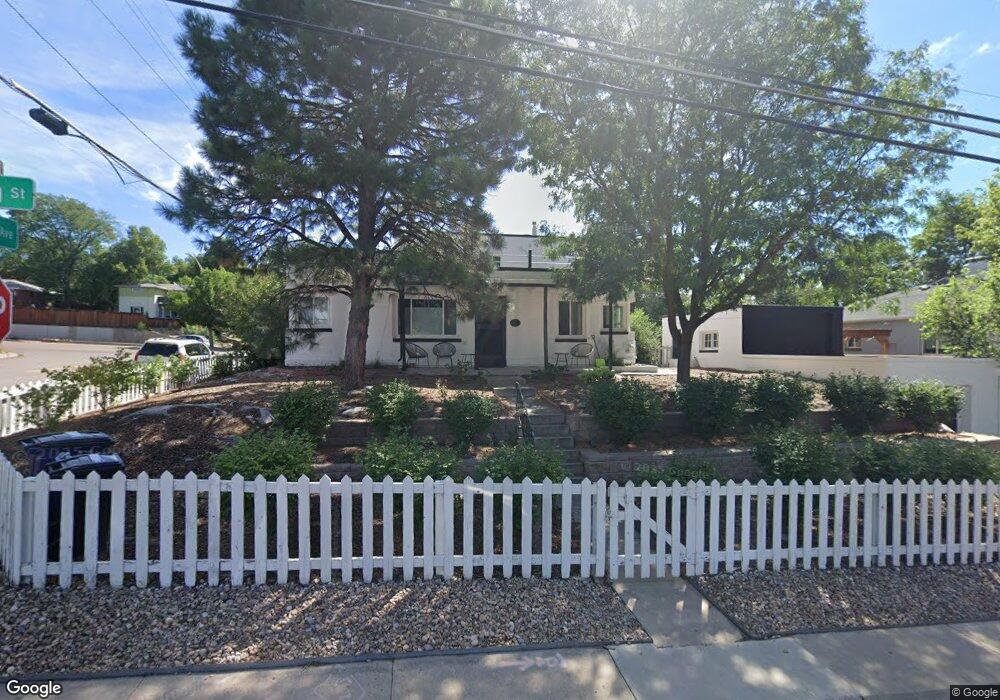
6 S Harrison St Denver, CO 80209
Cherry Creek NeighborhoodEstimated Value: $877,000 - $1,163,381
4
Beds
3
Baths
2,041
Sq Ft
$500/Sq Ft
Est. Value
About This Home
This home is located at 6 S Harrison St, Denver, CO 80209 and is currently estimated at $1,020,191, approximately $499 per square foot. 6 S Harrison St is a home located in Denver County with nearby schools including Steck Elementary School, Hill Campus of Arts & Sciences, and George Washington High School.
Ownership History
Date
Name
Owned For
Owner Type
Purchase Details
Closed on
Oct 31, 2017
Sold by
Lappen Stephan F
Bought by
Allred Laura
Current Estimated Value
Purchase Details
Closed on
Feb 12, 2004
Sold by
Lappen Stephan F and Henson Isaaca K
Bought by
Lappen Stephan F
Home Financials for this Owner
Home Financials are based on the most recent Mortgage that was taken out on this home.
Original Mortgage
$310,400
Interest Rate
5.62%
Mortgage Type
New Conventional
Purchase Details
Closed on
May 8, 2001
Sold by
Cisneros Gene
Bought by
Hanson Isaaca K and Allred Laura S
Home Financials for this Owner
Home Financials are based on the most recent Mortgage that was taken out on this home.
Original Mortgage
$337,500
Interest Rate
8%
Mortgage Type
Seller Take Back
Purchase Details
Closed on
Feb 27, 1998
Sold by
Jurgens Dann L
Bought by
Cisneros Gene
Home Financials for this Owner
Home Financials are based on the most recent Mortgage that was taken out on this home.
Original Mortgage
$138,375
Interest Rate
7.01%
Create a Home Valuation Report for This Property
The Home Valuation Report is an in-depth analysis detailing your home's value as well as a comparison with similar homes in the area
Home Values in the Area
Average Home Value in this Area
Purchase History
| Date | Buyer | Sale Price | Title Company |
|---|---|---|---|
| Allred Laura | -- | None Available | |
| Lappen Stephan F | -- | -- | |
| Hanson Isaaca K | $375,000 | Land Title Guarantee Company | |
| Cisneros Gene | $184,500 | -- |
Source: Public Records
Mortgage History
| Date | Status | Borrower | Loan Amount |
|---|---|---|---|
| Previous Owner | Lappen Stephan F | $310,400 | |
| Previous Owner | Hanson Isaaca K | $337,500 | |
| Previous Owner | Cisneros Gene | $138,375 | |
| Closed | Lappen Stephan F | $19,400 |
Source: Public Records
Tax History Compared to Growth
Tax History
| Year | Tax Paid | Tax Assessment Tax Assessment Total Assessment is a certain percentage of the fair market value that is determined by local assessors to be the total taxable value of land and additions on the property. | Land | Improvement |
|---|---|---|---|---|
| 2024 | $4,218 | $53,260 | $36,960 | $16,300 |
| 2023 | $4,127 | $53,260 | $36,960 | $16,300 |
| 2022 | $3,525 | $44,330 | $36,670 | $7,660 |
| 2021 | $3,479 | $46,620 | $38,560 | $8,060 |
| 2020 | $3,291 | $44,360 | $36,150 | $8,210 |
| 2019 | $3,199 | $44,360 | $36,150 | $8,210 |
| 2018 | $3,104 | $40,120 | $26,140 | $13,980 |
| 2017 | $3,095 | $40,120 | $26,140 | $13,980 |
| 2016 | $2,794 | $34,260 | $24,087 | $10,173 |
| 2015 | $2,677 | $44,640 | $24,087 | $20,553 |
| 2014 | $2,291 | $27,580 | $17,440 | $10,140 |
Source: Public Records
Map
Nearby Homes
- 36 Harrison St
- 41 Harrison St
- 21 S Jackson St
- 79 S Albion St
- 1 Ash St
- 45 Jackson St Unit D
- 73 Albion St
- 50 Albion St
- 77 S Ash St
- 42 S Ash St
- 163 S Harrison St
- 133 S Jackson St Unit A7
- 275 S Harrison St Unit 602
- 11 Monroe St Unit 103
- 217 S Jackson St Unit H
- 14 S Madison St
- 111 S Monroe St Unit 303
- 162 Ash St
- 2630 N Birch St
- 253 S Jackson St
- 16 S Harrison St
- 15 & 21 S Colorado Blvd
- 15 S Colorado Blvd
- 15 S Colorado Blvd Unit 15 & 21
- 13 S Harrison St
- 3955 E Ellsworth Ave
- 1 Colorado Blvd
- 18 Harrison St
- 21 S Harrison St Unit 3
- 19 S Harrison St Unit 2
- 4 S Colorado Blvd
- 2 S Colorado Blvd
- 3840 E Ellsworth Ave
- 15 S Harrison St
- 15 S Harrison St
- 23 S Harrison St
- 17 S Harrison St
- 37 S Colorado Blvd Unit 39
- 27 S Harrison St
- 27 S Harrison St