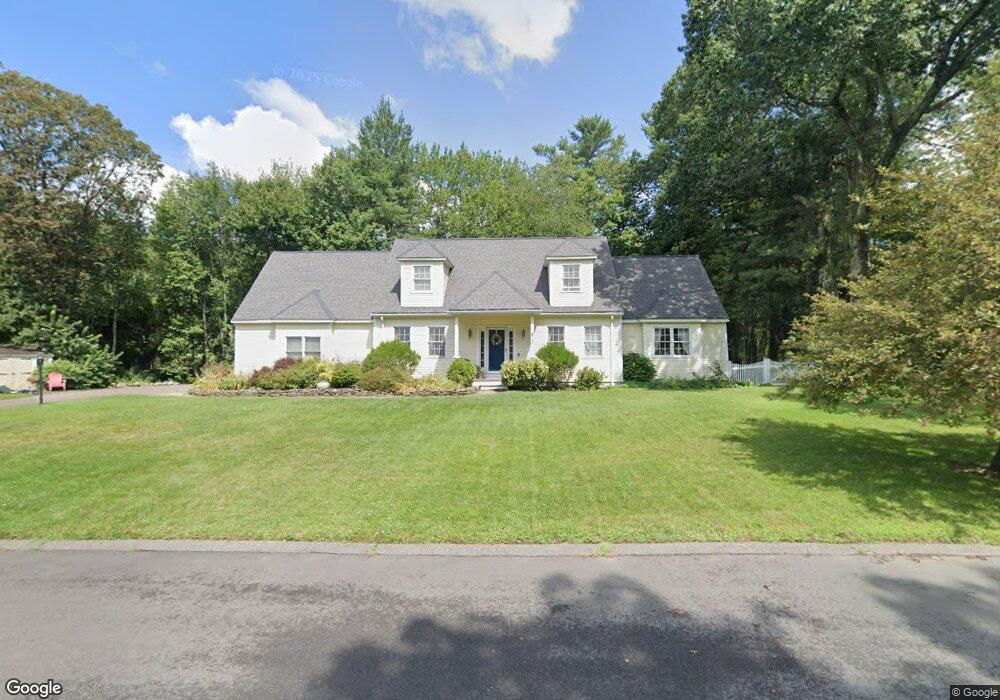
6 Samos Cir Middleton, MA 01949
Estimated Value: $942,641 - $1,405,000
4
Beds
3
Baths
2,621
Sq Ft
$424/Sq Ft
Est. Value
About This Home
This home is located at 6 Samos Cir, Middleton, MA 01949 and is currently estimated at $1,111,660, approximately $424 per square foot. 6 Samos Cir is a home located in Essex County with nearby schools including Howe-Manning Elementary School, Fuller Meadow Elementary School, and Masconomet Regional Middle School.
Ownership History
Date
Name
Owned For
Owner Type
Purchase Details
Closed on
Jun 26, 2003
Sold by
Kosa Jaimi L and Kosa Jeffrey D
Bought by
Cunningham Thomas
Current Estimated Value
Home Financials for this Owner
Home Financials are based on the most recent Mortgage that was taken out on this home.
Original Mortgage
$190,000
Outstanding Balance
$82,806
Interest Rate
5.71%
Estimated Equity
$1,028,854
Purchase Details
Closed on
Aug 19, 1994
Sold by
Featherstone Corp
Bought by
Kosa Jeffrey D and Kosa Jaimi
Purchase Details
Closed on
Jun 9, 1993
Sold by
Mangino Saverio and Mangino Nancy
Bought by
Featherstone Corp
Purchase Details
Closed on
Mar 17, 1993
Sold by
Fdic
Bought by
Merlin Realty Corp
Create a Home Valuation Report for This Property
The Home Valuation Report is an in-depth analysis detailing your home's value as well as a comparison with similar homes in the area
Home Values in the Area
Average Home Value in this Area
Purchase History
| Date | Buyer | Sale Price | Title Company |
|---|---|---|---|
| Cunningham Thomas | $556,000 | -- | |
| Cunningham Thomas | $556,000 | -- | |
| Kosa Jeffrey D | $279,900 | -- | |
| Kosa Jeffrey D | $279,900 | -- | |
| Featherstone Corp | $76,500 | -- | |
| Featherstone Corp | $76,500 | -- | |
| Merlin Realty Corp | $24,000 | -- | |
| Merlin Realty Corp | $24,000 | -- |
Source: Public Records
Mortgage History
| Date | Status | Borrower | Loan Amount |
|---|---|---|---|
| Open | Merlin Realty Corp | $190,000 | |
| Previous Owner | Merlin Realty Corp | $280,000 |
Source: Public Records
Tax History
| Year | Tax Paid | Tax Assessment Tax Assessment Total Assessment is a certain percentage of the fair market value that is determined by local assessors to be the total taxable value of land and additions on the property. | Land | Improvement |
|---|---|---|---|---|
| 2025 | $9,621 | $809,200 | $419,200 | $390,000 |
| 2024 | $10,067 | $853,900 | $439,200 | $414,700 |
| 2023 | $8,573 | $666,100 | $365,200 | $300,900 |
| 2022 | $9,256 | $698,600 | $393,300 | $305,300 |
| 2021 | $7,863 | $573,100 | $285,600 | $287,500 |
| 2020 | $7,773 | $570,700 | $279,600 | $291,100 |
| 2019 | $8,267 | $603,900 | $303,600 | $300,300 |
| 2018 | $8,197 | $587,200 | $303,600 | $283,600 |
| 2017 | $7,850 | $562,700 | $293,600 | $269,100 |
| 2016 | $7,213 | $519,300 | $267,600 | $251,700 |
| 2015 | $6,901 | $500,800 | $263,600 | $237,200 |
Source: Public Records
Map
Nearby Homes
- 1 Couture Way
- 12 Couture Way
- 2 Tyler Ln
- 6 Cabral Dr
- 1 Mills Point Unit 1
- 19 Peachey Cir
- 40 Glen Dr
- 6 White Ln
- 7 James Ave
- 2 Wedge Ct Unit 2
- 23 Hamilton Rd
- 15 Rowell Ln Unit 15
- 24 Worcester Rd
- 14 Niblick Way
- 1466 Main St
- 47 Maple St Unit A
- 35 Catherine Dr
- 9 Stableford Ct Unit 9
- 7 Stableford Ct Unit 10
- 5 Stableford Ct Unit 11
Your Personal Tour Guide
Ask me questions while you tour the home.