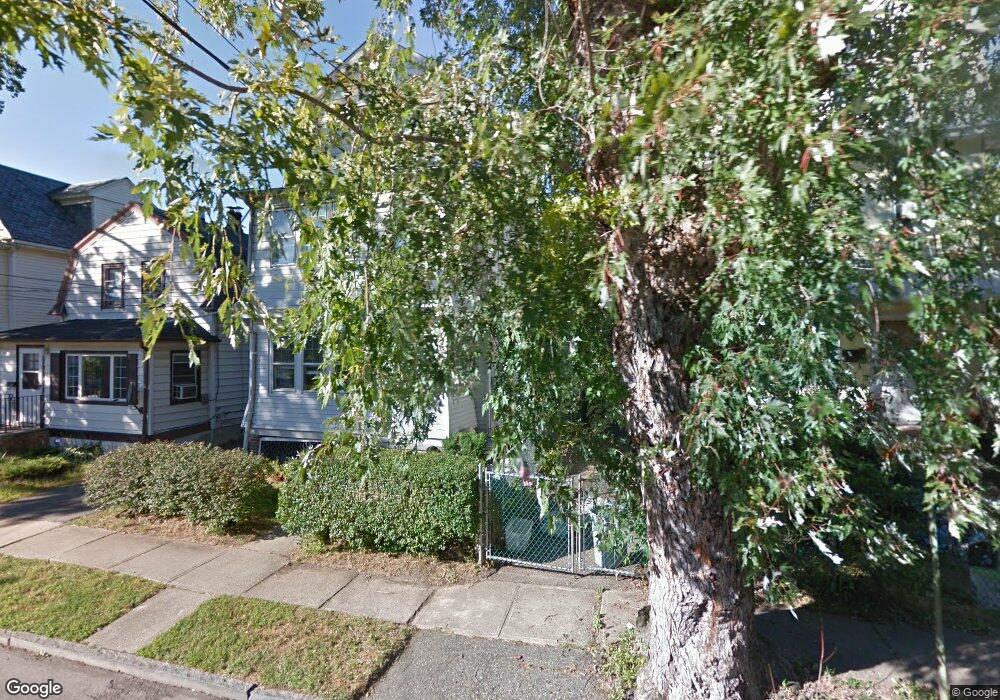
6 Samuel St Unit 1 West Orange, NJ 07052
Estimated Value: $578,000 - $784,000
2
Beds
1
Bath
1,722
Sq Ft
$382/Sq Ft
Est. Value
About This Home
This home is located at 6 Samuel St Unit 1, West Orange, NJ 07052 and is currently estimated at $657,166, approximately $381 per square foot. 6 Samuel St Unit 1 is a home located in Essex County with nearby schools including West Orange High School, East Orange Community Charter School, and Mount Carmel Guild Academy.
Ownership History
Date
Name
Owned For
Owner Type
Purchase Details
Closed on
Feb 16, 2024
Sold by
Brennan Eugene
Bought by
Garcia Olga Arias and Ramirez Wilson F
Current Estimated Value
Home Financials for this Owner
Home Financials are based on the most recent Mortgage that was taken out on this home.
Original Mortgage
$416,250
Outstanding Balance
$408,963
Interest Rate
6.66%
Mortgage Type
New Conventional
Estimated Equity
$248,203
Purchase Details
Closed on
May 5, 2009
Sold by
Brennan Eugene R
Bought by
Brennan Eugene R and Brennan Grace
Create a Home Valuation Report for This Property
The Home Valuation Report is an in-depth analysis detailing your home's value as well as a comparison with similar homes in the area
Home Values in the Area
Average Home Value in this Area
Purchase History
| Date | Buyer | Sale Price | Title Company |
|---|---|---|---|
| Garcia Olga Arias | $525,000 | American Land Title | |
| Brennan Eugene R | -- | None Available |
Source: Public Records
Mortgage History
| Date | Status | Borrower | Loan Amount |
|---|---|---|---|
| Open | Garcia Olga Arias | $416,250 |
Source: Public Records
Tax History Compared to Growth
Tax History
| Year | Tax Paid | Tax Assessment Tax Assessment Total Assessment is a certain percentage of the fair market value that is determined by local assessors to be the total taxable value of land and additions on the property. | Land | Improvement |
|---|---|---|---|---|
| 2025 | $11,006 | $483,300 | $167,000 | $316,300 |
| 2024 | $11,006 | $244,800 | $89,100 | $155,700 |
| 2022 | $10,612 | $244,800 | $89,100 | $155,700 |
| 2021 | $10,409 | $244,800 | $89,100 | $155,700 |
| 2020 | $10,237 | $244,800 | $89,100 | $155,700 |
| 2019 | $9,936 | $244,800 | $89,100 | $155,700 |
| 2018 | $9,635 | $244,800 | $89,100 | $155,700 |
| 2017 | $9,508 | $244,800 | $89,100 | $155,700 |
| 2016 | $9,273 | $244,800 | $89,100 | $155,700 |
| 2015 | $9,094 | $244,800 | $89,100 | $155,700 |
| 2014 | $8,910 | $244,800 | $89,100 | $155,700 |
Source: Public Records
Map
Nearby Homes
- 2 Fremont St
- 42 Franklin Place
- 5 Franklin Ave
- 7 Franklin Ave
- 7 Virginia Ave
- 29 Enfield Ave
- 132 Franklin Ave
- 77 Harrison Ave Unit 79
- 79 Harrison Ave
- 107 High St
- 194 Harrison Ave
- 3 Winfield St
- 102 Harrison Ave
- 110 Whittlesey Ave
- 175 Harrison Ave
- 36 William St
- 350 Main St
- 9 Rosedale Ave
- 188 High St
- 190 Watchung Ave