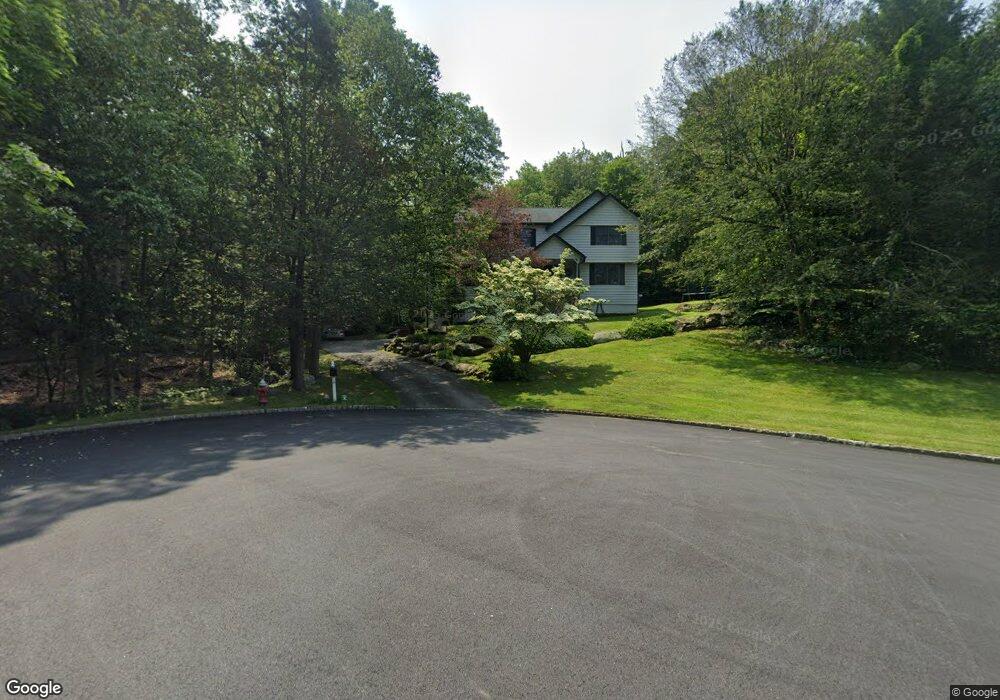
6 Scott Ct Kinnelon, NJ 07405
Estimated Value: $812,000 - $1,003,000
--
Bed
--
Bath
2,908
Sq Ft
$321/Sq Ft
Est. Value
About This Home
This home is located at 6 Scott Ct, Kinnelon, NJ 07405 and is currently estimated at $932,184, approximately $320 per square foot. 6 Scott Ct is a home located in Morris County with nearby schools including Kiel School, Stonybrook School, and Pearl R. Miller Middle School.
Ownership History
Date
Name
Owned For
Owner Type
Purchase Details
Closed on
Jan 28, 2011
Sold by
Kochan Leela
Bought by
Sun Lisong and Liu Zhongmei
Current Estimated Value
Home Financials for this Owner
Home Financials are based on the most recent Mortgage that was taken out on this home.
Original Mortgage
$417,000
Outstanding Balance
$15,480
Interest Rate
4.21%
Mortgage Type
New Conventional
Estimated Equity
$916,704
Purchase Details
Closed on
Jun 30, 2000
Sold by
Ritt Glenn H and Urraro Joan
Bought by
Kochan Leela
Create a Home Valuation Report for This Property
The Home Valuation Report is an in-depth analysis detailing your home's value as well as a comparison with similar homes in the area
Home Values in the Area
Average Home Value in this Area
Purchase History
| Date | Buyer | Sale Price | Title Company |
|---|---|---|---|
| Sun Lisong | $535,000 | First American Title Ins Co | |
| Kochan Leela | $535,000 | -- |
Source: Public Records
Mortgage History
| Date | Status | Borrower | Loan Amount |
|---|---|---|---|
| Open | Sun Lisong | $417,000 |
Source: Public Records
Tax History Compared to Growth
Tax History
| Year | Tax Paid | Tax Assessment Tax Assessment Total Assessment is a certain percentage of the fair market value that is determined by local assessors to be the total taxable value of land and additions on the property. | Land | Improvement |
|---|---|---|---|---|
| 2025 | $17,321 | $597,900 | $197,200 | $400,700 |
| 2024 | $16,962 | $597,900 | $197,200 | $400,700 |
| 2023 | $16,962 | $597,900 | $197,200 | $400,700 |
| 2022 | $16,125 | $597,900 | $197,200 | $400,700 |
| 2021 | $16,125 | $597,900 | $197,200 | $400,700 |
| 2020 | $15,826 | $597,900 | $197,200 | $400,700 |
| 2019 | $15,462 | $597,900 | $197,200 | $400,700 |
| 2018 | $15,145 | $597,900 | $197,200 | $400,700 |
| 2017 | $14,888 | $597,900 | $197,200 | $400,700 |
| 2016 | $12,679 | $390,000 | $257,200 | $132,800 |
| 2015 | $12,176 | $390,000 | $257,200 | $132,800 |
| 2014 | $11,969 | $390,000 | $257,200 | $132,800 |
Source: Public Records
Map
Nearby Homes
- 47 Cutlass Rd
- 5 Powderhorn Dr
- 17 Carl Place
- 69 Halina Ln
- 29 Halina Ln Unit 54
- 94 Saw Mill Rd
- 8 Denise Dr
- 233 Boonton Ave
- 114 Bartholdi Ave
- 176 Boonton Ave
- 5 Richard Ct
- 5319 Sanctuary Blvd Unit 5319
- 5107 Sanctuary Blvd Unit 5107
- 5211 Sanctuary Blvd Unit 5211
- 6402 Brookhaven Ct Unit 6402
- 6220 Brookhaven Ct Unit 6220
- 141 Boonton Ave
- 5 Old Gormley Ln