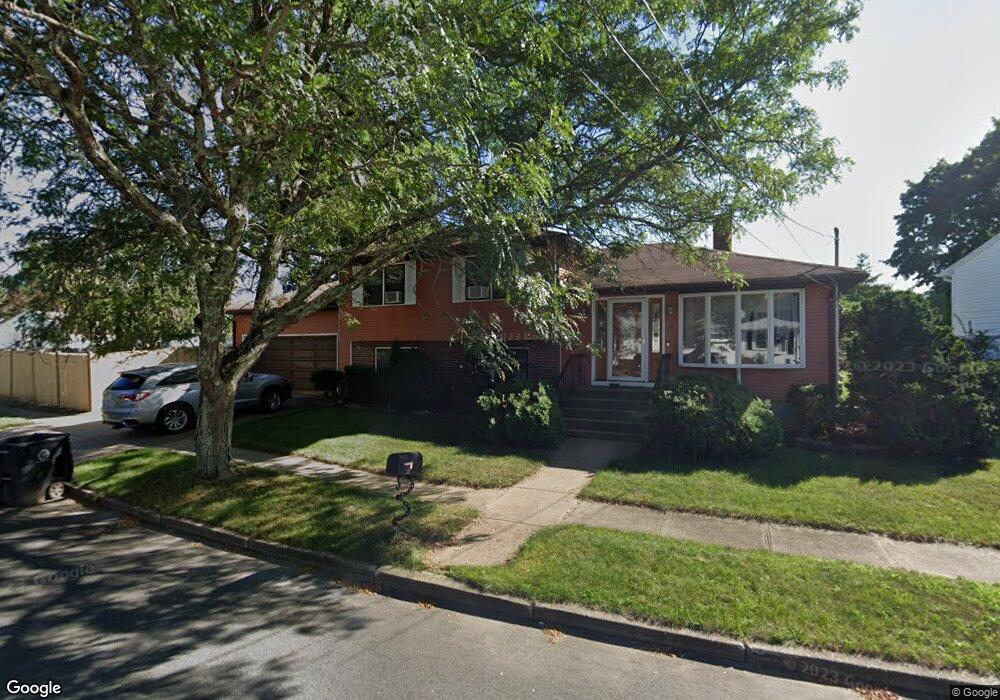
6 Scott Dr Riverside, RI 02915
Riverside NeighborhoodEstimated Value: $458,000 - $552,000
3
Beds
3
Baths
2,668
Sq Ft
$194/Sq Ft
Est. Value
About This Home
This home is located at 6 Scott Dr, Riverside, RI 02915 and is currently estimated at $518,393, approximately $194 per square foot. 6 Scott Dr is a home located in Providence County with nearby schools including East Providence High School, St Luke Elementary School, and St Mary Academy-Bay View.
Ownership History
Date
Name
Owned For
Owner Type
Purchase Details
Closed on
Nov 24, 1997
Sold by
Miguel Richard J and Miguel Arlene
Bought by
Hanley Patrick F and Hanley Donna
Current Estimated Value
Home Financials for this Owner
Home Financials are based on the most recent Mortgage that was taken out on this home.
Original Mortgage
$128,170
Interest Rate
7.17%
Mortgage Type
Purchase Money Mortgage
Create a Home Valuation Report for This Property
The Home Valuation Report is an in-depth analysis detailing your home's value as well as a comparison with similar homes in the area
Home Values in the Area
Average Home Value in this Area
Purchase History
| Date | Buyer | Sale Price | Title Company |
|---|---|---|---|
| Hanley Patrick F | $129,000 | -- | |
| Hanley Patrick F | $129,000 | -- |
Source: Public Records
Mortgage History
| Date | Status | Borrower | Loan Amount |
|---|---|---|---|
| Closed | Hanley Patrick F | $127,000 | |
| Closed | Hanley Patrick F | $70,000 | |
| Closed | Hanley Patrick F | $154,000 | |
| Closed | Hanley Patrick F | $128,170 |
Source: Public Records
Tax History Compared to Growth
Tax History
| Year | Tax Paid | Tax Assessment Tax Assessment Total Assessment is a certain percentage of the fair market value that is determined by local assessors to be the total taxable value of land and additions on the property. | Land | Improvement |
|---|---|---|---|---|
| 2025 | $6,364 | $486,900 | $129,700 | $357,200 |
| 2024 | $6,169 | $402,400 | $108,200 | $294,200 |
| 2023 | $5,939 | $402,400 | $108,200 | $294,200 |
| 2022 | $5,974 | $273,300 | $64,100 | $209,200 |
| 2021 | $5,876 | $273,300 | $56,900 | $216,400 |
| 2020 | $5,627 | $273,300 | $56,900 | $216,400 |
| 2019 | $5,471 | $273,300 | $56,900 | $216,400 |
| 2018 | $5,777 | $252,500 | $55,400 | $197,100 |
| 2017 | $5,648 | $252,500 | $55,400 | $197,100 |
| 2016 | $5,621 | $252,500 | $55,400 | $197,100 |
| 2015 | $5,685 | $247,700 | $51,300 | $196,400 |
| 2014 | $5,685 | $247,700 | $51,300 | $196,400 |
Source: Public Records
Map
Nearby Homes