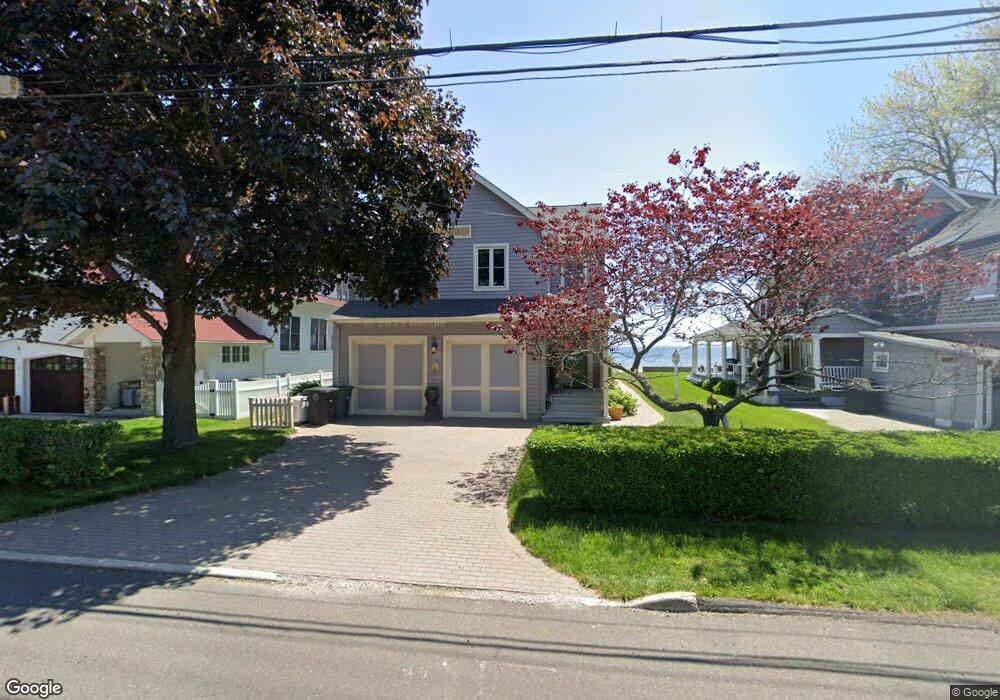
6 Seaview Ave Milford, CT 06460
Devon NeighborhoodEstimated Value: $1,586,000 - $2,249,000
4
Beds
3
Baths
2,988
Sq Ft
$628/Sq Ft
Est. Value
About This Home
This home is located at 6 Seaview Ave, Milford, CT 06460 and is currently estimated at $1,877,517, approximately $628 per square foot. 6 Seaview Ave is a home located in New Haven County with nearby schools including Pumpkin Delight School, West Shore Middle School, and Jonathan Law High School.
Ownership History
Date
Name
Owned For
Owner Type
Purchase Details
Closed on
Dec 4, 2025
Sold by
Howlett Marybeth
Bought by
Schreiner Benjamin and Schreiner Amanda G
Current Estimated Value
Home Financials for this Owner
Home Financials are based on the most recent Mortgage that was taken out on this home.
Original Mortgage
$1,140,000
Outstanding Balance
$1,137,126
Interest Rate
4.75%
Mortgage Type
New Conventional
Estimated Equity
$740,391
Purchase Details
Closed on
Jan 20, 2023
Sold by
Auger William J
Bought by
Howlett Marybeth
Purchase Details
Closed on
Oct 17, 2022
Sold by
Auger William J
Bought by
Howlett Marybeth
Purchase Details
Closed on
Mar 12, 2015
Sold by
Zeigon Deborah J
Bought by
Kehoe Patricia A
Purchase Details
Closed on
Aug 15, 1972
Bought by
Auger William J and Auger Patricia
Create a Home Valuation Report for This Property
The Home Valuation Report is an in-depth analysis detailing your home's value as well as a comparison with similar homes in the area
Home Values in the Area
Average Home Value in this Area
Purchase History
| Date | Buyer | Sale Price | Title Company |
|---|---|---|---|
| Schreiner Benjamin | $2,400,000 | -- | |
| Howlett Marybeth | -- | None Available | |
| Howlett Marybeth | -- | None Available | |
| Howlett Marybeth | -- | None Available | |
| Howlett Marybeth | -- | None Available | |
| Kehoe Patricia A | -- | -- | |
| Kehoe Patricia A | -- | -- | |
| Auger William J | -- | -- |
Source: Public Records
Mortgage History
| Date | Status | Borrower | Loan Amount |
|---|---|---|---|
| Open | Schreiner Benjamin | $1,140,000 |
Source: Public Records
Tax History
| Year | Tax Paid | Tax Assessment Tax Assessment Total Assessment is a certain percentage of the fair market value that is determined by local assessors to be the total taxable value of land and additions on the property. | Land | Improvement |
|---|---|---|---|---|
| 2025 | $33,194 | $1,123,320 | $777,550 | $345,770 |
| 2024 | $32,734 | $1,123,320 | $777,550 | $345,770 |
| 2023 | $30,521 | $1,123,320 | $777,550 | $345,770 |
| 2022 | $29,936 | $1,123,320 | $777,550 | $345,770 |
| 2021 | $23,852 | $862,650 | $573,300 | $289,350 |
| 2020 | $23,878 | $862,650 | $573,300 | $289,350 |
| 2019 | $23,904 | $862,650 | $573,300 | $289,350 |
| 2018 | $23,930 | $862,650 | $573,300 | $289,350 |
| 2017 | $23,973 | $862,650 | $573,300 | $289,350 |
| 2016 | $21,418 | $769,340 | $573,300 | $196,040 |
| 2015 | $21,449 | $769,340 | $573,300 | $196,040 |
| 2014 | $20,941 | $769,340 | $573,300 | $196,040 |
Source: Public Records
Map
Nearby Homes
- 212 Milford Point Rd
- 37 8th Ave
- 3 Francis St
- 253 Broadway
- 67 Hauser St
- 66 Birch Ave
- 24 Botsford Ave
- 295 Housatonic Dr
- 9 Stowe Ave
- Dewey Ave
- 12 Naugatuck Ave Unit A7
- 151 Naugatuck Ave
- 65 Eastern Pkwy
- 47 Peak Ave
- 17 Lincoln Ave
- 21 Matthews St
- 0 Saco St
- 299 Meadows End Rd
- 85 Viscount Dr Unit A26
- 85 Viscount Dr Unit 2F
Your Personal Tour Guide
Ask me questions while you tour the home.